MOVE On Up – And Don’t Worry Too Much About Bond Vol
As the Federal Reserve looks towards tapering its accommodative monetary policy, it isn’t a surprise that the MOVE index (which measures volatility in the bond market) has experienced a sharp uptick (Figure 1). In reaction to the rise in short-term rates, there have been large unwinds as macro funds have sought to exit steepener trades – further contributing to the volatility.
While the fixed income market has become choppier, it has been a contrasting story in equities where, supported by a good earnings season, the VIX index has declined.
This has resulted in a spread of about 50 points. While this may seem high versus recent history, this level of discrepancy between equity and bond vol is not unprecedented (Figure 2). On a 1-year lookback, the change in the MOVE-VIX spread is at 2.1 standard deviations. However, with a 10-year lookback, the current spread is only at 0.75 standard deviations.
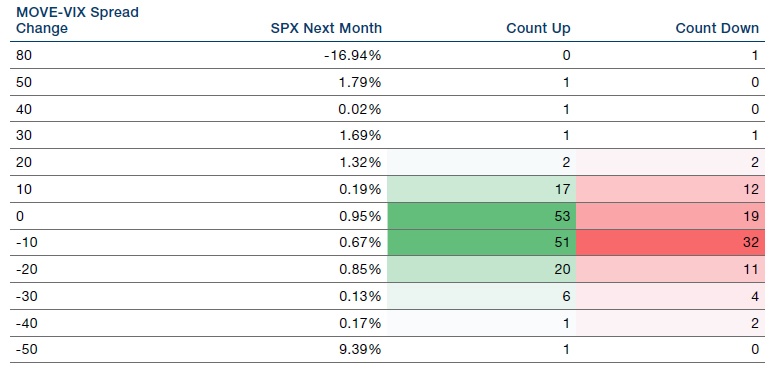
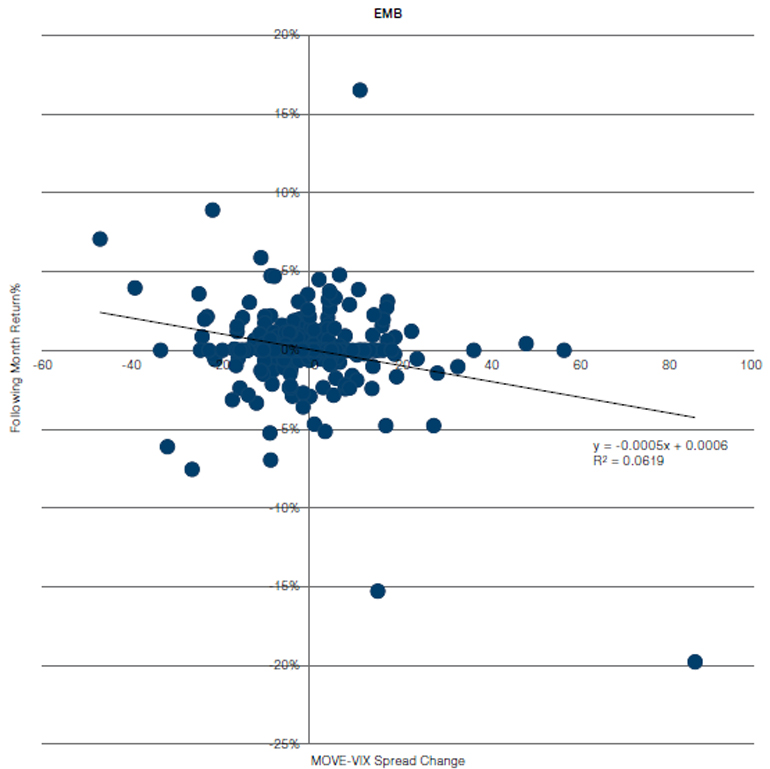
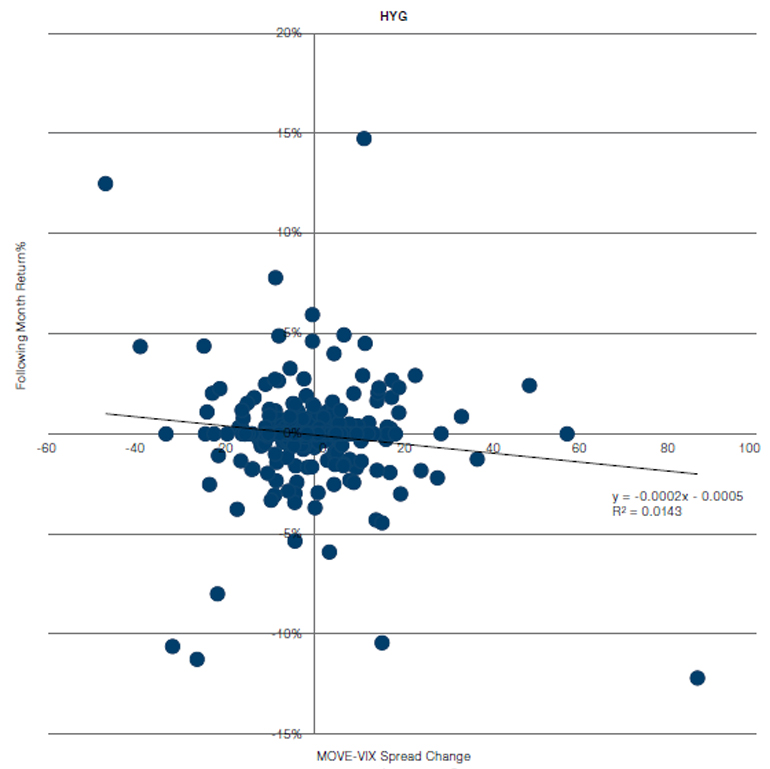
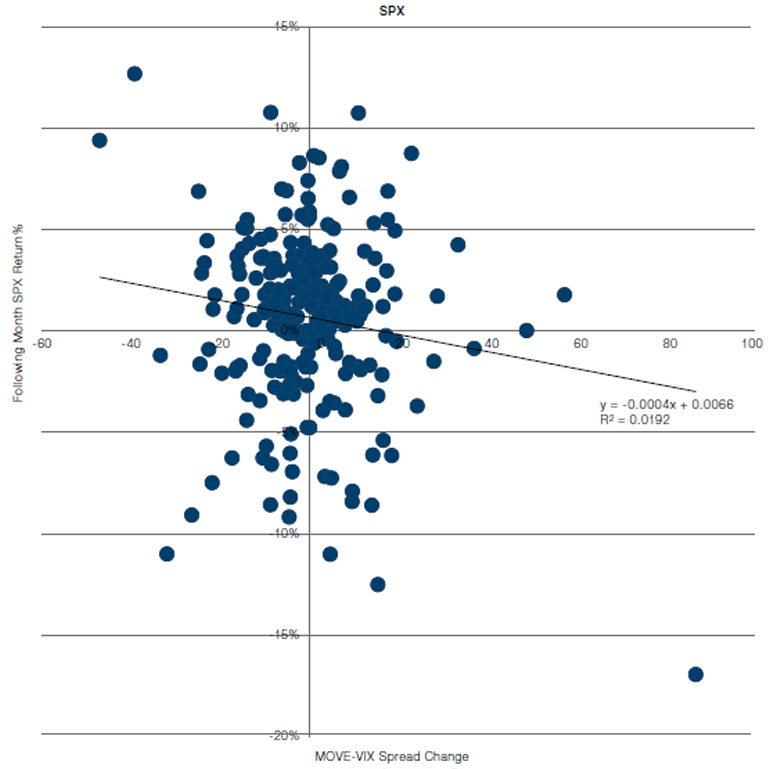
Looking forward, jumps in the MOVE-VIX spread have not been predictive of imminent equity declines (Figures 3-4). History would therefore indicate that the bear flattener we are currently experiencing will not lead to equity turmoil. The picture is also similar in both high-yield bonds and emerging market debt (Figures 5-6).
Problems loading this infographic? - Please click here
Source: Man Group, Bloomberg; as of 2 November 2021.
Problems loading this infographic? - Please click here
Source: Man Group, Bloomberg; as of 2 November 2021.
Figure 3. S&P 500 Returns After a MOVE-VIX Spread Change
Source: Man Group, Bloomberg; as of 2 November 2021.
Figure 4. Distribution of S&P 500 Returns After a MOVE-VIX Spread Change
Source: Man Group, Bloomberg; as of 2 November 2021.
Figure 5. Distribution of High Yield Bond Returns After a MOVE-VIX Spread Change
Source: Man Group, Bloomberg; as of 2 November 2021.
Figure 6. Distribution of Emerging-Market Debt Returns After a MOVE-VIX Spread Change
Source: Man Group, Bloomberg; as of 2 November 2021.
Employers’ Unholy Trinity: Quit Rates, Vacancies and Wages
Wages are a lagging indicator of inflation. Nevertheless, they are an important component of every inflationary cycle: as inflation rises, workers demand pay rises to maintain their standard of living. This both confirms that inflation has well and truly set in, and then drives inflation higher by further boosting demand.
And wages are now on the move: as of the end of the third quarter, the employment cost index for civilian workers in the US rose 4.2% year-on-year (Figure 7). Pipeline measures also indicate that the rise might not be temporary. The US quits rate (which measures how many employees are leaving their jobs) and the NFIB survey on hardto-fill jobs have both spiked to all-time highs as of 4 November 2021. For employers, it is a unholy trinity: staff are quitting at a higher rate than ever, they are struggling to recruit to fill positions, and when they do find a candidate, they are having to pay them much more than before.
An interesting sidelight on this wage growth is the Cleveland Fed’s median CPI measure. The current median CPI item is shelter. As we have previously mentioned, this is both the largest CPI component and one of the most important from an inflationary perspective. Housing costs usually represent the largest single outlay from a worker’s pay packet, and therefore a rising price of shelter can be seen as a key pain point sparking demands for higher salaries. If the cost of shelter continues its upward trend, it is likely that wages will continue to follow.
Figure 7. Employment Cost Index Versus Median CPI
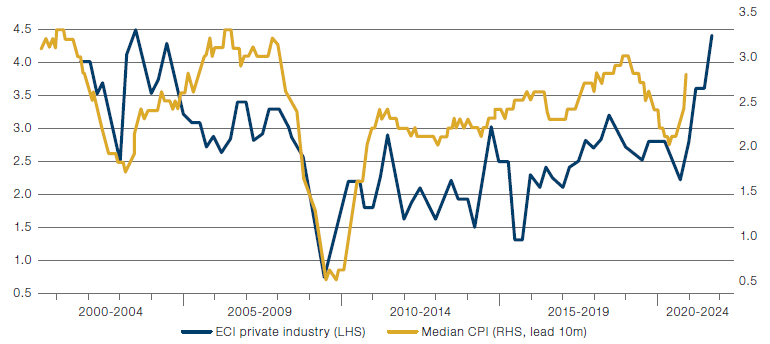
Source: Bureau of Labor Statistics, Federal Reserve Bank of Cleveland; as of 3 November 2021.
Figure 8. JOLTS Quits Rate
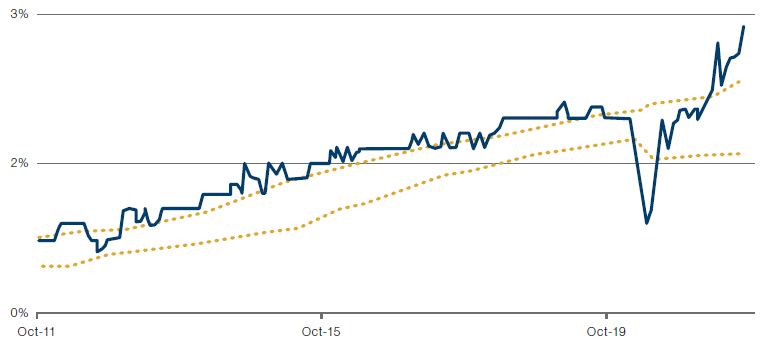
Source: Bloomberg; as of 4 November 2021.
Figure 9. NFIB Jobs Hard to Fill
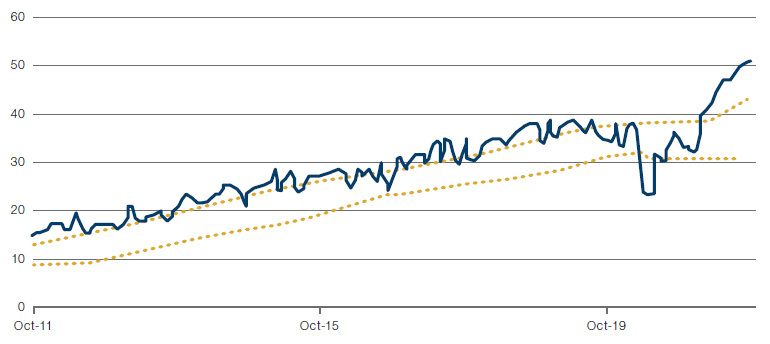
Source: Bloomberg; as of 4 November 2021.
With contributions from: Leo Cheng Liu (Man Solutions, Portfolio Manager), Ed Cole (Man GLG, Managing Director – Discretionary Investments) and Henry Neville (Man Solutions, Analyst)
You are now leaving Man Group’s website
You are leaving Man Group’s website and entering a third-party website that is not controlled, maintained, or monitored by Man Group. Man Group is not responsible for the content or availability of the third-party website. By leaving Man Group’s website, you will be subject to the third-party website’s terms, policies and/or notices, including those related to privacy and security, as applicable.