Inflation: What Indicators Do We Monitor?
The US April CPI print caught many commentators by surprise. Even for those expecting it to be boosted by base effect, 4.2% was higher than anticipated. Despite this print, many are expecting this to be a short inflationary hump, reasoning that since the CPI basket stopped falling in absolute terms in May 2020, the base effect will soon wash out. We take a different view: while the price of the CPI basket did start to rise in June, its low starting level will see ample room for big year-on-year increases. We would not be surprised by readings above 4% for May and June and 3.5% for July – in contrast to the roughly 2% average for the previous cycle.
However, such high headline expectations force us to subject our thesis to a robust degree of challenge. What exactly are we looking at when we think about inflation?
The first thing we attempt to do is to consider the direction of ‘deep core’ inflationary measures. Core inflationary measures already remove components that are volatile – for example, fuel prices. We attempt to go a level further and get to the ‘core of core’; for example, recognising that building materials will be more price volatile than train tickets. By removing the volatile components, we isolate the stickiest components of the inflation baskets. This is because we recognise that while inflationary regimes are themselves quite sticky, once a new trend starts to become entrenched it proves very difficult to shift.
These deep core measures, illustrated in Figure 1, currently indicate a degree of deflation.
Figure 1. Inflation Momentum Measures
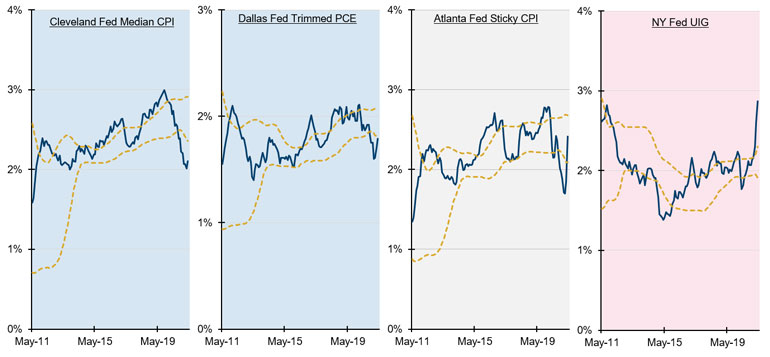
Source: Man Solutions; as of 4 June 2021.
Those Flashing Red…
The next thing we consider is our inflation pipeline: a series of indicators which consider the future direction of input costs and therefore impact the direction of inflation. For instance, if manufacturers pay higher prices, all things being equal, this should lead to higher costs for consumers down the line. Most components of our inflation pipeline are now flashing red, and have been for some time, indicating the possibility of sustained price rises (Figure 2).
Critically, however, shelter CPI (the measure of rental costs, with economists estimating the equivalent rental costs for consumers who own their homes outright) is currently deflationary. This reading makes up about a third of the inflation basket. If this component also starts to move upwards, we could expect much higher CPI print overall, especially since rising housing costs are a big driving factors of wage inflation.
The third thing we consider is inflation expectations. Inflation expectations themselves can be self-fulfilling. If you are going to buy a car in three months but believe we will see inflation, it is logical to buy the car now to try and avoid the increased costs. If everyone starts following the same logic, a sharp increase in current demand can create the very inflation consumers are seeking to get ahead of.
Again, the components of inflation expectations are flashing red (Figure 3). It is also worth noting the breadth of these expectations: the Conference Board and University of Michigan expectations track consumer inflation expectations; the 10-year breakeven proxies the expectations of the buy-side; and our sell side indicator tracks the expectations of economists at major Wall Street banks. All three major communities seem to be united in expecting higher inflation.
Figure 2. Inflation Pipeline
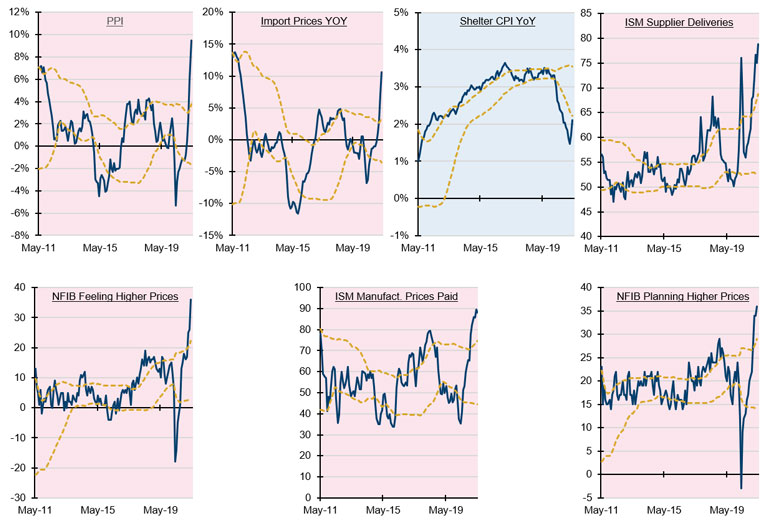
Source: Man Solutions; as of 4 June 2021.
Figure 3. Inflation Expectations
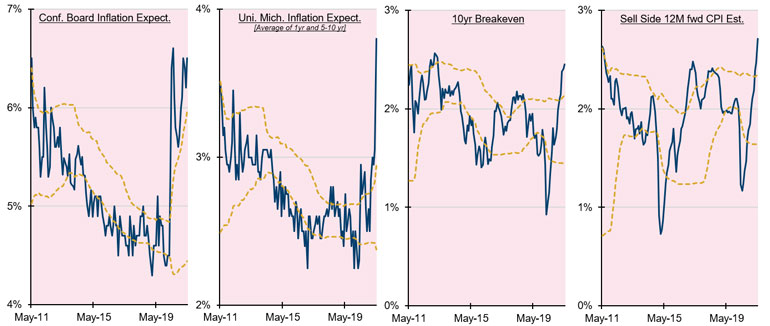
Source: Man Solutions; as of 4 June 2021.
…And Those Not Flashing at All
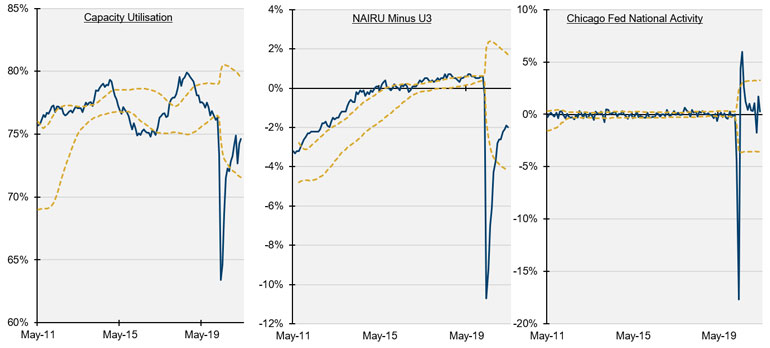
To counter our thesis, the fourth thing we look at – economic slack – shows little sign of being inflationary, with across-the-board neutral readings, indicating a degree of capacity in the economy (Figure 4).
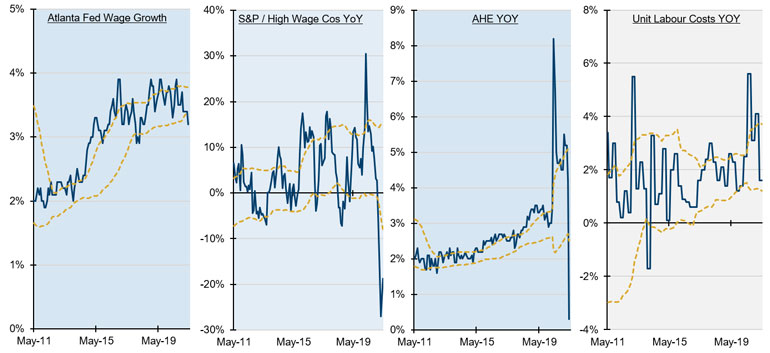
This is particularly important because economic slack has a high degree of influence on wage inflation, which is a critical indicator of an overall regime change. Wage inflation is important for two reasons: first, because the cost of wages is a major component of the goods and services we buy; and second, because wage inflation is usually one of the last indicators of a regime change. Put simply, it is often only when inflation starts to increase the cost of living significantly that workers feel empowered enough to ask their bosses for a pay rise. Our view is that it is only when we see sustained wage inflation that we will finally get confirmation of our regime change thesis.
The most important of these indicators, the Atlantic Fed Wage Growth tracker, shows little wage growth at all, despite anecdotal evidence of skill shortages and labour supply bottlenecks (Figure 5).
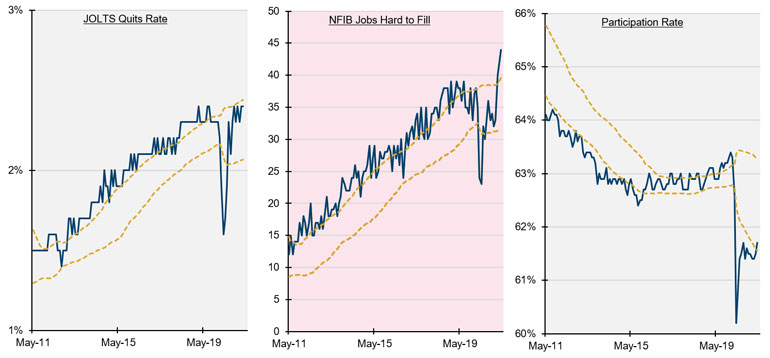
The final dog that hasn’t barked is labour tightness, particularly the participation rate (Figure 6), which is now at 62%. This is a full percentage point below pre-pandemic levels, indicating that there is good deal of labour which can still be utilised, dampening down any short-term prospect of wage increases.
Figure 4. Economic Slack
Source: Man Solutions; as of 4 June 2021.
Figure 5. Wage Inflation
Source: Man Solutions; as of 4 June 2021.
Figure 6. Labour Tightness
Source: Man Solutions; as of 4 June 2021.
With contribution from: Henry Neville (Man Solutions, Analyst).
You are now leaving Man Group’s website
You are leaving Man Group’s website and entering a third-party website that is not controlled, maintained, or monitored by Man Group. Man Group is not responsible for the content or availability of the third-party website. By leaving Man Group’s website, you will be subject to the third-party website’s terms, policies and/or notices, including those related to privacy and security, as applicable.