Quote of the Week:
"It’ll all be revealed, it’s going to come out. But after the audit."
Frothing, Then Bubbling
On a Barra factor basis, it has been relatively easy to explain the selloff in the three weeks to 18September: momentum collapsed.
Inter-quintile returns showed that no other factor performed particularly well in response, meaning that there was no factor rotation to provide support – instead, the market went straight down (Figure 1).
But how does this move in the three weeks to 18 September compare with the rest of the year? More context is given by Barra factor performance year-to-date (Figure 2), with the blue bars illustrating the moves between the start of the year and 21 August, and the yellow bars illustrating the moves between 24 August and 18 September. There are three main themes to point out:
- While Value has finally started working, this is miniscule compared with the negative trend seen earlier in the year;
- Volatility, Liquidity (or Barra’s measure of excess turnover) and Speculative Risk – measure of speculation and frothiness in the market – have been positive this year;
- None of the ‘fundamental’ measures, except for Growth, have performed well.
There are also regional disparities within factor performance (Figure 3):
- Value has struggled in all regions, but has struggled the most in the US;
- Momentum has performed well in all regions, especially in Europe and emerging markets;
- The performance of Speculative Risk and Liquidity – measures of frothiness in markets – has been rewarded in the US relative to Europe, which has seen flat or negative returns, respectively, for both factors.
Figure 1. Barra Momentum Collapses in Three Weeks to 18 September
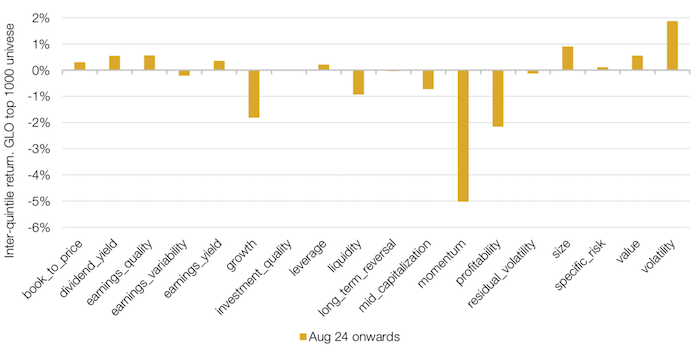
Source: Bloomberg, Man Numeric; between 24 August and 18 September 2020.
Figure 2. Performance of Barra Factors in 2020
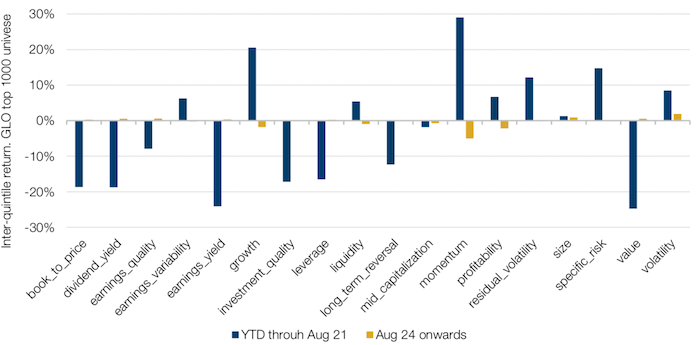
Source: Bloomberg, Man Numeric; between 24 August and 18 September 2020.
Figure 3. Performance of Barra Factors by Region
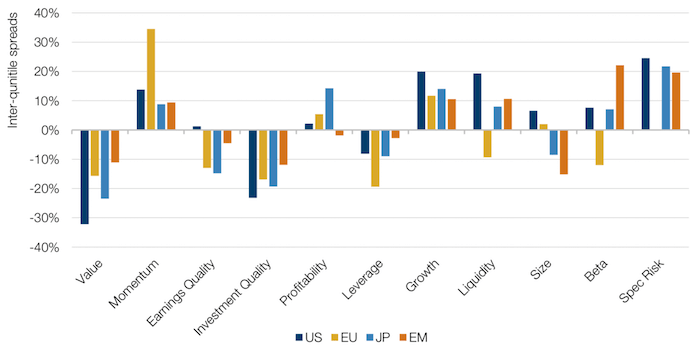
Source: Bloomberg, Man Numeric; as of 18 September 2020.
A Following Wind: Chinese Bonds and the FTSE Russell
Last week, index provider FTSE Russell announced the inclusion of Chinese bonds in its World Government Bond Index from 2021 at estimated 5.7%. This will almost certainly accelerate foreign inflows, which have been on a tear in 2020 (Figure 4).
By our estimates, the value of the stock of foreign owned Chinese government and agency bonds is less than 1% of the market cap of the Bloomberg Barclays Global Aggregate for treasuries and agencies. As a share of the total stock of Chinese bonds, it’s around 8%. In contrast, in many other emerging markets, the figure regularly exceeds 20% (Figure 5).
Figure 4. Foreign Ownership of Chinese Treasury and Agency Bonds
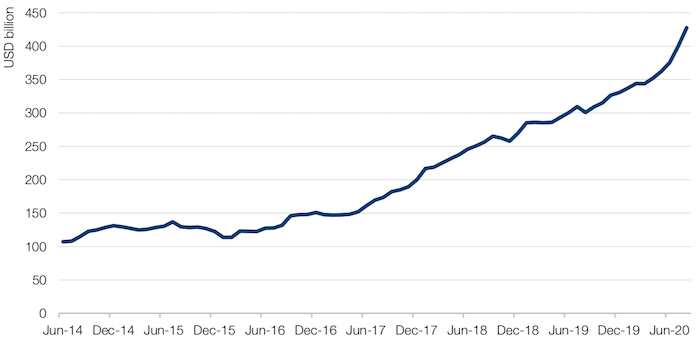
Source: Man Group, Bloomberg, Chinabond; as of 24 September 2020.
Figure 5. Foreign Ownership of Chinese Treasury and Agency Bonds
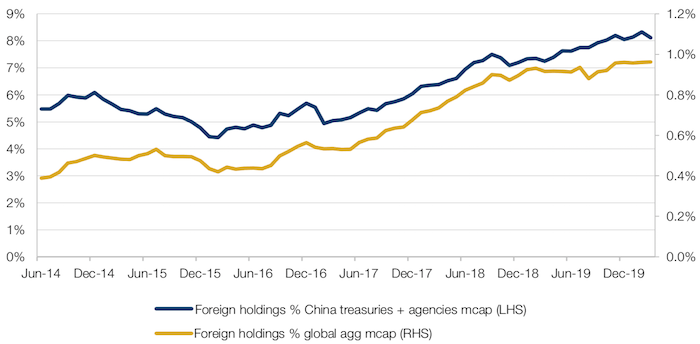
Source: Man Group, Bloomberg, Chinabond; as of 24 September 2020.
A combination of factors – incoming flows, a booming export sector which has taken market share in most major markets during the COVID-19 crisis, and widening spreads between Chinese government bonds and the US – are a reasonable backdrop for a stronger Chinese yuan over the medium term, in our view. This, in turn, could create a tailwind for Asia versus the rest of the world. Figure 6 shows the very tight inverse relationship between a stronger yuan and Asia ex-Japan’s relative performance versus the MSCI World over recent years.
Figure 6. CNY – Asia ex-Japan Versus MSCI World
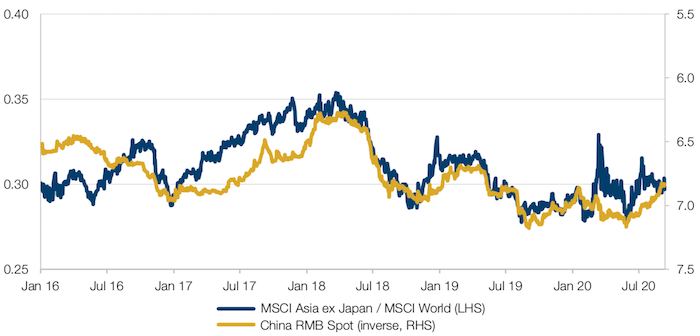
Source: Bloomberg; as of 24 September 2020.
There should be one other material attraction for allocators as Chinese markets continue to open up. In a recent article, we illustrated the potential diversification benefits of allocating to China. And indeed, with 10-year government bonds yielding 3%, and a firmly negative correlation between stocks and bonds, China stands out as a particularly promising destination for risk parity strategies.
Figure 7. Two-Year Rolling Stock/Bond Correlation by Region
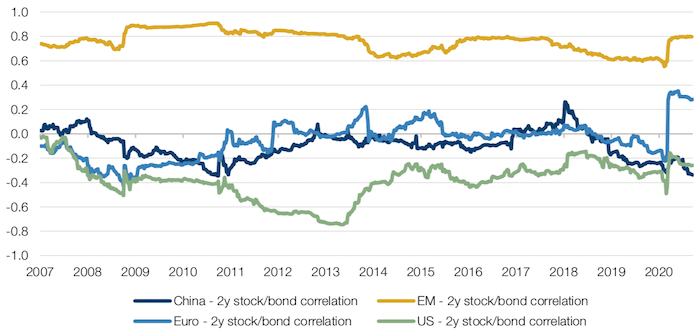
Source: Man Group, MSCI, Bloomberg; as of 24 September 2020.
Superforecaster's Super Forecasters
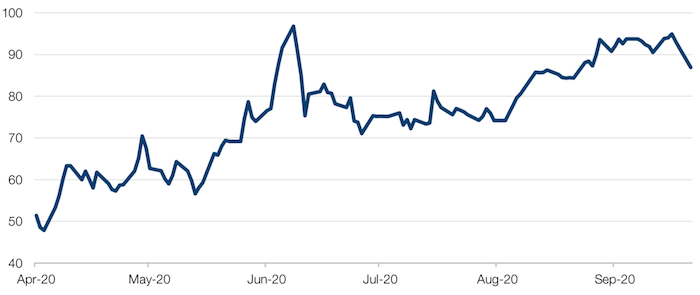
Two weeks ago, we observed a sharp decline in the Good Judgement Project’s (‘GJP’) Superforecaster survey of expectations regarding the timing of Covid-19 vaccine availability. The percentage of superforecasters anticipating distribution of 25 million doses of an FDA-approved vaccine in the US between 1 October, 2020 and 31 March, 2021 declined from a high of 71% on 8 September to 54% as of 23 September.
At the time, firms exposed to an extension of the pandemic – those in Goldman Sachs’s Health Risk Basket (namely airlines, casinos, hotels and cruises) – had not underperformed despite this renewed pessimism. However, it seems like the market has caught up with the Superforecasters – with the basket falling around five percentage points on 21 September – highlighting the slowness with which a theoretically efficient market sometimes reacts. In contrast, it bolsters the view that there if there is one thing better than the wisdom of the crowds, it is the wisdom of well-informed crowds – and that forecasting is vastly more successful in a probabilistic framework.
Figure 8. GJP Superforecasters Covid-19 Vaccine Predictions
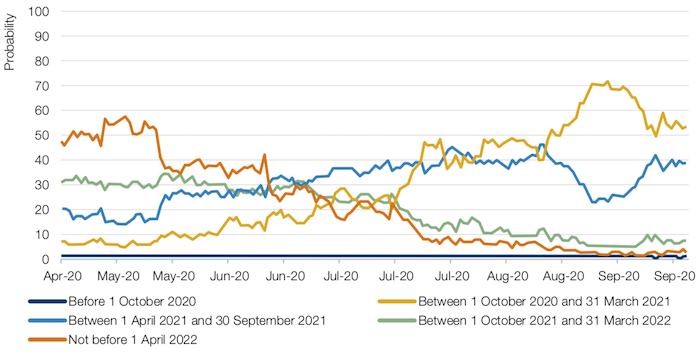
Source: The Good Judgement Project; as of 28 September 2020.
Figure 9. Goldman Sachs Health Risk Basket
Source: The Good Judgement Project; as of 28 September 2020.
The Trials and Tribulations of Factor Correlations
Just a few weeks ago, we discussed how a factor-tracking index might have several unintentional secondary exposures – and how Momentum and Growth were perhaps the true culprits behind a Value index’s torrid 2020. We’ve explored this idea further, looking into the correlations between these two factors. While some factor correlations may be structural – such as Growth and Value’s historically negative correlation – investors should note when these begin to reach unusual depths or heights. In our review of the data, we found that the 2-year rolling correlations of Momentum and Growth are unusually elevated. Conversely, Momentum and Beta correlations are notably negative.
This is significant for investors seeking meaningful diversification in their factor exposure. A higher Momentum stock is now more likely than normal to be a Growth or a low-beta stock at the same time. While many factors are typically correlated within themselves, unusual correlation situations such as this make it more difficult for investors to gain a full picture of the characteristics of a stock and ensure their portfolio has the necessary diversification.
Figure 10. Momentum Versus Growth Correlation (2-year Rolling)
Source: Man Numeric, as of 11 September 2020.
Figure 11. Momentum versus Beta Correlation (Two-year Rolling)
Source: Man Numeric, as of 11 September 2020.
With contributions from: Jay Rajamony (Man Numeric - Head of Alternatives), Ed Cole (Man GLG - Managing Director – Equities), and Ikitsa Anastasov (Man GLG - Deputy Head Portfolio Manager).
You are now leaving Man Group’s website
You are leaving Man Group’s website and entering a third-party website that is not controlled, maintained, or monitored by Man Group. Man Group is not responsible for the content or availability of the third-party website. By leaving Man Group’s website, you will be subject to the third-party website’s terms, policies and/or notices, including those related to privacy and security, as applicable.