Quote of the Week:
"If you are so pessimistic, then why don't you consider the value of the Vision Fund as zero. Then there is no downside."
Still the Bridesmaid: Value in a Growth Driven World
Has the Growth sell-off been good for Value? In short, no.
The rolling 12-month spread between the Russell 1000 Value and Growth indices reached 44% at the end of August, its highest level since the inception of the index, surpassing even the Growth stock mania of the tech bubble at the turn of the millennium. Whilst it has since fallen back to 38% as of 11 September, the environment remains extreme.
But what makes the picture even more disconcerting is that this spread widening has occurred against the backdrop of a sharp Momentum selloff during August – with large cap Momentum down 6.4% and small cap down 3.6%. Since Momentum had previously consisted of large-cap Growth names, the fact that the Growth-Value spread has not narrowed is indicative of largely flat month for Value.
Figure 1. Russell 1000 - Rolling 12-month Spread
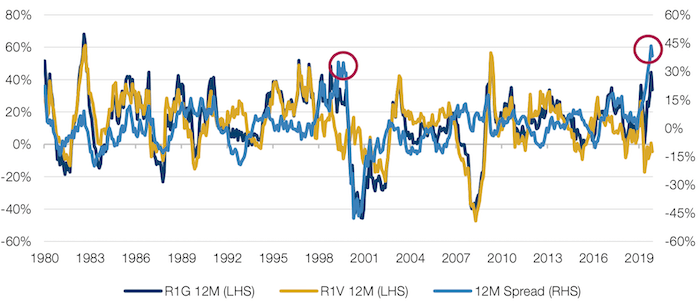
Source: Bloomberg, Man Numeric; as of 11 September 2020.
What’s the ‘Value’ of Factor Indices?
Do factor indices actually represent the performance of their eponymous factors? It should be a simple question to answer, but maddeningly, an affirmative answer isn’t always possible.
The devil lies in the detail of the underlying stocks – for instance, a company may have a lot of Growth characteristics, but it might also have some Momentum or other factor indicators besides. Figure 2 shows the example of two representations of Value performance in the Asia ex-Japan market since the beginning of the year. These two measures aim to capture the returns of the same factor, yet the MSCI index has seen a more than 30% drawdown while Barra performance has remained flat. Why should this be so?
Figure 2. Value vs. Value
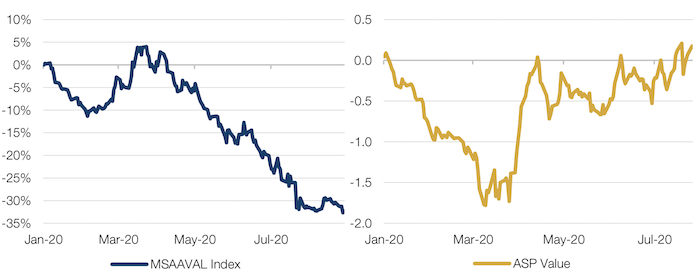
Source: Bloomberg, MSCI, Barra; as of 27 July 2020.
The answer lies in the nature of MSCI’s stock-specific risk on the one hand and the resulting secondary factor exposures on the other. The MSCI AC Asia ex Japan Value Index is calculated on a total return basis and, according to our calculations, a full one half of its returns can be attributed to idiosyncratic risk and the other half to factor performance and not all of it is a result of its Value exposure.
If we consider the Barra performance to be the ‘pure’ expression of the Value factor in this region, other factors must be weighing on the performance of the MSCI index. In the decomposed factor breakdown, we can see that while Value is a strong contributor, Momentum and Growth are the real culprits for the index’s underperformance, both showing negative returns year-to-date.
Figure 3. Decomposed Factors of the MSCI AC Asia ex Japan Value Index
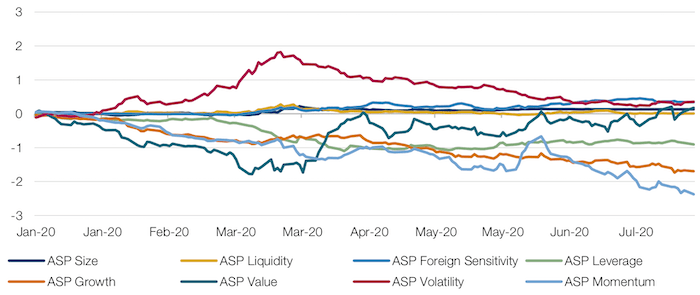
Source: Bloomberg, MSCI; as of 28 August 2020.
Unintentional secondary exposures are not unique to this factor or region. Investors looking to add or monitor their factor exposure should therefore be careful when considering ‘single’ factor indices and pay greater attention to the breakdown of factor composites as well as idiosyncratic contributions to performance.
With contribution from: Dan Taylor (CIO – Man Numeric) and Ikitsa Anastasov (Deputy Portfolio Manager – Man GLG).
You are now leaving Man Group’s website
You are leaving Man Group’s website and entering a third-party website that is not controlled, maintained, or monitored by Man Group. Man Group is not responsible for the content or availability of the third-party website. By leaving Man Group’s website, you will be subject to the third-party website’s terms, policies and/or notices, including those related to privacy and security, as applicable.