Introduction
Returns during the Covid-19 crisis are a reminder of how Chinese assets behave materially differently from the rest of the world. The same explanations are typically rolled out – a closed capital account, a market dominated by retail investors, heavy state intervention. There is, no doubt, some truth to these narratives.
But, whatever the reasons, it is clear that diversification benefits for international investors exist. And given the huge market capitalisation of Chinese assets, this diversification does not come at the expense of liquidity, whatever the size of the portfolio. With that in mind, it is mystifying to us that foreign involvement in Chinese domestic assets remains so relatively insignificant, and – following the additional index inclusions of 2019 – the outperformance of Chinese equities in 2020, the underweighting has become both starker and less comprehensible.
There is no shortage of macro doom-mongers seeking to educate us as to why Chinese assets should be avoided at all costs. But the truth remains that after a decade of these arguments, the diversification benefits persist, and it is easy to construct equally apocalyptic scenarios for other regions firmly part of mainstream allocations.
In that context, the purpose of this article is to attempt to: show how Chinese assets have acted as a diversifier over the last decade; to map out how big Chinese assets could become in global markets in the event that somewhat arbitrary caps on exposure are lifted over time; to look at the current levels of underexposure; and to address the opportunity for extracting alpha from Chinese equities.
The first in a series of two articles, this paper looks at diversification benefits of the last decade from a top-down perspective, existing allocations and the potential growth in international benchmarks in the future. The second article will look at systematic alpha generation in Chinese equities from a bottom-up perspective.
China as a Diversifier
Our first observation is that from a macro perspective, Chinese assets represent a diversifier for an international allocator. Figure 1 shows 60/40 2-year correlations based on USD returns for large-cap stocks and government bonds in each region. It is notable that while mainstream emerging markets (‘EM’) and Europe are materially and persistently correlated to US, the correlation of Chinese assets to the US differs substantially, even managing to be inversely correlated prior to the Lehman Brothers’ bankruptcy, and again in early 2015.
Figure 1. Regional Correlations
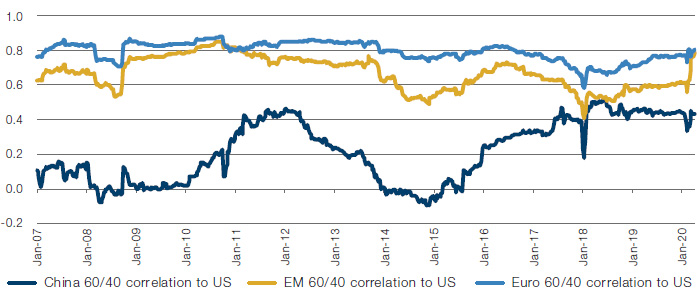
Source: MSCI, Bloomberg, Man Group; as of 17 April 2020. For illustrative purposes only.
It is also notable that Chinese assets have danced to their own tune during the Covid-19 pandemic, with the correlation broadly stable over the last two years. In comparison, mainstream EM has succumbed to its habitual behaviour of diminishing idiosyncrasy, with price behaviour entirely determined by global trends, just at higher beta.
The second observation – and one that came as a great surprise to us – is that a Chinese 60/40 approach has delivered better absolute returns over the last five years, and in spite of materially higher volatility than other regions, a Sharpe ratio superior to either Europe or mainstream EM.
Figure 2. Regional 60/40 Returns
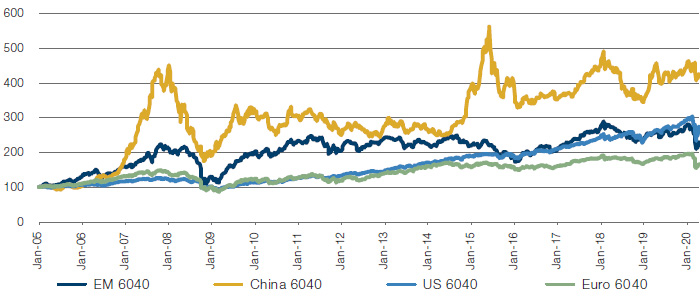
Source: MSCI, Bloomberg, Man Group; as of 17 April 2020. For illustrative purposes only.
Normalised to 100 on 7 January 2007.
Figure 3. Regional 60/40 Metrics
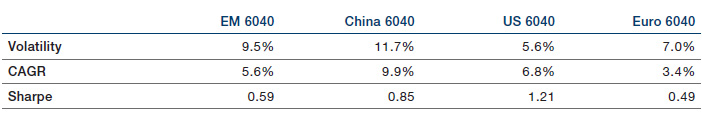
Source: MSCI, Bloomberg, Man Group; as of 17 April 2020. For illustrative purposes only.
Note: Sharpe ratio is calculated without reference to risk-free returns.
The third observation – and a partial explanation for why Chinese returns have been superior to those of mainstream EM – is that a China 60/40 behaves much more like a developed market (‘DM’) than a traditional EM. In traditional EMs, local currency bonds are not a diversifier – they typically move in the same direction as equities, albeit with differing beta characteristics. This is mostly explained by all asset price sensitivity to the US dollar – when currencies weaken, investors across asset classes move out at the same time, and the domestic saver is typically small in comparison to the foreign investor. The 2-year stock/bond correlation for China has, on average, been negative for most of the last 15-years, a dynamic much more akin to developed markets than other EMs. There is a valid debate about the persistence of negative stock/bond correlations, well enunciated by our colleagues at Man Solutions. But as long as it persists, there is the potential for better risk-adjusted returns from Chinese assets than from mainstream EM.
Figure 4. Stock/Bond Correlations
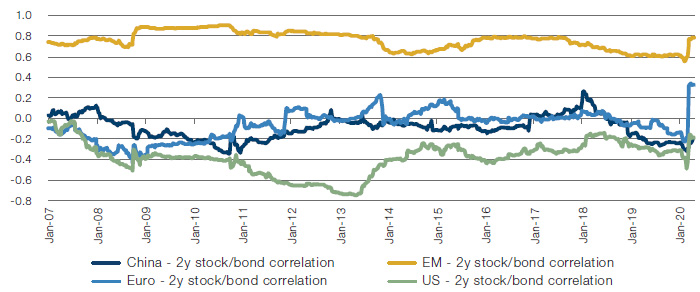
Source: MSCI, Bloomberg, Man Group; as of 17 April 2020.
So, a top-down allocation to Chinese assets has historically yielded: 1) high absolute returns; 2) a reasonable Sharpe ratio; 3) at certain times de-correlation versus other regions, and; 4) superior risk management attributes versus mainstream EM (with which it will typically be compared).
Figure 5 shows some relatively arbitrary allocation scenarios to 60/40 strategies for the last 15 years:
- 50% US, 30% Europe, 20% EM (no onshore China);
- 50% US, 30% Europe, 10% EM, 10% China;
- 45% US, 25% Europe, 5% EM, 20% China.
Figure 5. Allocation Scenarios
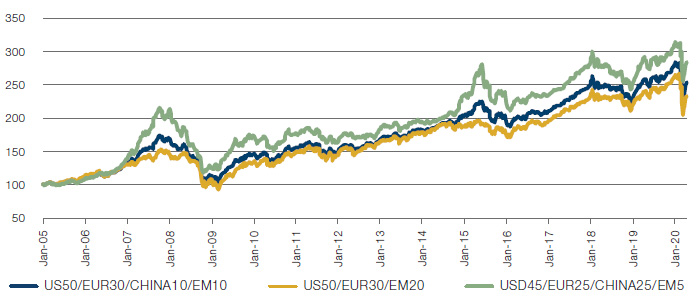
Source: MSCI, Bloomberg, Man Group; As of 17 April 2020. For illustrative purposes only.
Normalised to 100 on 7 January 2005.
Figure 6 shows that by adding the diversifying characteristics of Chinese assets, the volatility of the strategy comes down, and the returns go up. What’s not to like?
Figure 6. Adding Chinese Assets Reduces Volatility and Increases Returns
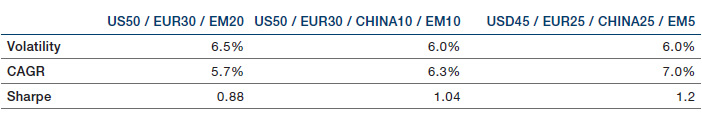
Source: MSCI, Bloomberg, Man Group; as of 17 April 2020.
It’s Only Getting Bigger
The idea of a 25% allocation to China might be too much for most people’s blood. And, in reality, the scenarios shown above were constructed deliberately to explore the impact of material inclusions on risk and returns.
But it is worth taking some time to look at the size of Chinese asset markets in international benchmarks, and to think about how large they could get without arbitrary caps on inclusion.
At the end of November, MSCI implemented the third phase of its staggered inclusion of China A in its indices. And at the end of the first quarter of this year, Chinese onshore weights in the MSCI All-Country World stood at c.55 basis points. By our estimates, foreign investors have roughly matched this exposure in their portfolios: the sum of holdings via Hong Kong Connect to Shanghai and Shenzhen stands at approximately USD140 billion, and Qualified Foreign Institutional Approved Quotas at a little over USD110 billion. Assuming that these quotas are fully utilised (they’re almost certainly not), that puts the total foreign ownership at a little over USD250 billion, equivalent to 63bp of end-March MSCI ACWI market cap.
Figure 7. Foreign Holdings of Chinese Equities
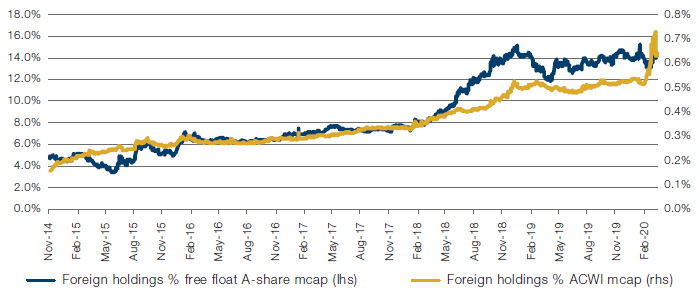
Source: Bloomberg, MSCI, Man Group; as of 31 March 2020.
We have little truck with the idea that it is all well and good being in line with the index. Even ignoring the diversification benefits we have discussed above, and the alpha opportunities we will discuss in the second article, it is clear that index weights are artificially subdued by caps that to us appear arbitrary, and have been present in some form in other EMs over time. For example, some of the key concerns over access are the following:
- Offshore access to onshore assets via segregated channels, namely Stock Connect;
- A lack of omnibus accounts;
- Access to hedging instruments;
- T-0 settlement.
The first of these was a permanent feature of access to Russian capital markets until the 2010s: access was principally via global depository receipts (‘GDRs’) listed in London, which were not fungible locally. It is also a current feature of Chinese-listed American Depository Receipts (‘ADRs’) and Hong Kong H-shares, which are actually shell structures reflecting an economic interest, but not ownership rights (Variable Interest Entities, VIEs).
Secondly, omnibus accounting was wholly absent from Korea and Taiwan until shortly before the subprime crisis.
Thirdly, access to hedging is fickle in many jurisdictions, including much of Europe during the subprime crisis, the sovereign debt crisis and during the Covid-19 pandemic.
Fourthly, T-0 settlement was a mainstay of Israeli and Saudi markets, and was not an impediment to proper index inclusion.
Removal of these arbitrary inclusion factors would put onshore Chinese equity weights in MSCI ACWI 7x higher, at c.4.5% of MSCI ACWI, roughly doubling the total Chinese weight.
The picture of foreign ownership in Chinese government and agency bonds is similar, with holdings by foreign banks and ‘external institutions’ (which we assume to be asset managers and insurance companies) at approximately USD340 billion, or 8% of the capitalisation of the combined agency and treasury markets and roughly 90bp of the combined global aggregate treasury and agency market capitalisations.
Figure 8. Foreign Holdings of Chinese Government and Agency Bonds
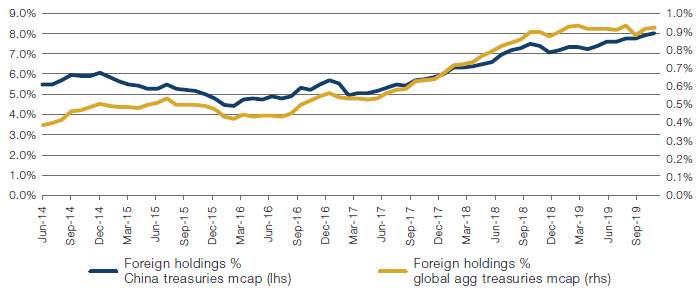
Source: Bloomberg, Chinabond, Man Group; as of 31 March 2020.
If foreign investors look beyond current benchmarks – and if the diversifying benefits persist, which we believe they will over time – the scale of underexposure relative to the size of the asset classes is gargantuan. Versus potential benchmark weights of 12% for bonds and 4.5% for equities, foreign allocations are underexposed by approximately USD5.5 trillion!
Figure 9. Foreign Underweight Versus Chinese Assets as % of Global Benchmark
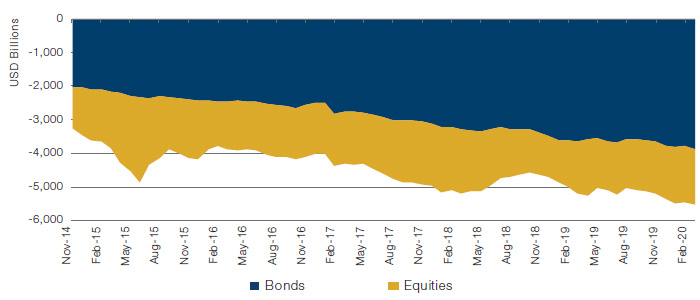
Source: Bloomberg, MSCI, Man Group; as of 31 March 2020.
What Does This Mean for Mainstream EM?
What would the scrapping of caps mean for allocators to EM specifically? MSCI currently operates with onshore Chinese equities included at 20% of a maximum 30% freefloat inclusion factor. So, the biggest Chinese A-share inclusion is 6% of market cap.
Figure 10 shows what would happen at 100% of the 30% freefloat inclusion factor, and beyond that at full freefloat, which would require a lifting of ownership limits in the Connect programme. Including listings of H-shares and ADRs, China’s full maximum weight in MSCI EM would be nearly 55%. In Asia-Pacific, Japan – at nearly 40% weight – has long been a discrete allocation decision. In global allocations, US – at over 60% – is also typically a discrete allocation. It is our expectation that as Chinese weights inevitably grow, and indeed, as its behaviour continues to differ from other EMs, it will increasingly become a discrete allocation decision.
Figure 10. Weight of China at Different Inclusion Factors
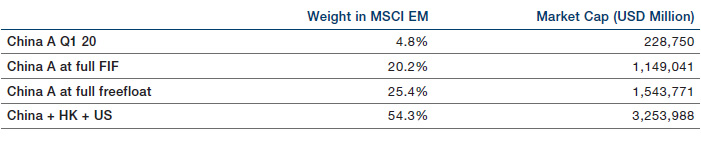
Source: Bloomberg, MSCI, Man Group; as of 31 March 2020
Conclusion
It may be that the lack of genuine investor engagement with Chinese stocks is more about arbitrary caps, anachronistic index weightings and an outdated mindset than anything more fundamental. We believe that Chinese equities offer significant diversification benefits to global investors and that there now exists sufficient breadth and liquidity here to argue for a much more prominent position in the global investment mix.
The recent outperformance of the Chinese markets in the wake of Coronavirus-related volatility wasn’t just a facet of China’s relative success in controlling the spread of the pandemic; rather it was illustrative of a deeper truth: that in China, they do things differently, and this is why we believe their stock market could offer such genuine diversification benefits.
You are now leaving Man Group’s website
You are leaving Man Group’s website and entering a third-party website that is not controlled, maintained, or monitored by Man Group. Man Group is not responsible for the content or availability of the third-party website. By leaving Man Group’s website, you will be subject to the third-party website’s terms, policies and/or notices, including those related to privacy and security, as applicable.