Introduction
ESG data has become a pivotal metric for investors and a source of distress at the same time. Theoretically it can give valuable insights into the sustainability and societal impact of a company - in practice the recent surge in data and vendors presents a unique set of challenges.
Environmental, Social, and Governance (ESG) data has become a pivotal metric for investors across the globe and a source of distress at the same time. Theoretically, ESG data can give insights into the sustainability and societal impacts of a company’s operations, guiding investors in making ethical and sustainable investment decisions and manage risk emanating from transitioning to a greener economy.
In practice, however, the rapidly expanding ESG data landscape and the multitude of data vendors present a unique set of challenges. These include missing data, difficult-to-understand models, biases (different methodologies in data collection and reporting) and an ever-changing regulatory landscape. This complicates the search for alpha in ESG, compliance with regulations, and the reduction of ESG risks. In addition it hampers the ability to create large enough investment universes for diversified portfolios.
Even at its most imperfect, ESG data is a fast-growing business. With an annual growth rate estimated at almost 30% between 2018 and 2021 the global market in ESG data was reckoned to be worth about $1.3 billion in 2022.1 The biggest market for this data is Europe and the biggest ESG data consumers are asset managers.2
While regulatory bodies in the European Union and the UK have started the process of consulting on and introducing regulation for ESG data and ratings providers,3,4 legislation and codes of conduct are still lacking detail and often require asset managers to report on issues that are not required from investees.
In the meantime, data science teams supporting investment managers – both discretionary and systematically - face the challenge of having to provide them with reliable and standardised data on a security-by-security level and systematically for a whole universe.
This paper delves into the shortfalls of the current ESG data landscape and proposes solutions, primarily focusing on vendor selection, data normalisation and combination, and two examples of how this applies to carbon and sustainable debt data.
First Challenge: The current ESG data landscape
Even though the overall global regulatory environment is still immature, in Europe ESG data needs to align with the SFDR (Sustainable Finance Disclosure Regulation) standards, a framework designed to improve transparency in the market for sustainable investment products and which helps their classification as Article 8 and Article 9 funds (green funds and dark green funds). It was designed to play a crucial role in mitigating reputation risk, greenwashing, and protects investors from costly fines.
The increase in regulatory requirements and the search for alpha in ESG investments have pushed up the supply of ESG data in recent years. Furthermore, the growth of ESG data is indicative of the increasing awareness and emphasis on sustainable investing.
Still, while this vast number of ESG datasets offers a wealth of information, it also presents a number of challenges in terms of quality and consistency.
Figure 1. Alternative ESG datasets have surged in recent years
Problems loading this infographic? - Please click here
Source: Neudata.
Variations in the methodologies and an increase in complexity requires a more granular classification.
Much of this stems from the variation in the methodologies that different data vendors employ to measure ESG metrics, making it difficult for investors to compare the data across different vendors.
Adding to this is an increase in complexity over the recent years marked by a shift away from scores and ratings to underlying data and data that helps to evaluate the impact of investments.
This requires more granular classification. One approach is to thematically divide it into categories such as raw data, derived data, scores, impact metrics, and estimated data. Figure 2 shows an example of the hierarchy of ESG data sets and categories, but please note that the list only shows a very high-level overview of differences.
Figure 2. Classification of ESG data
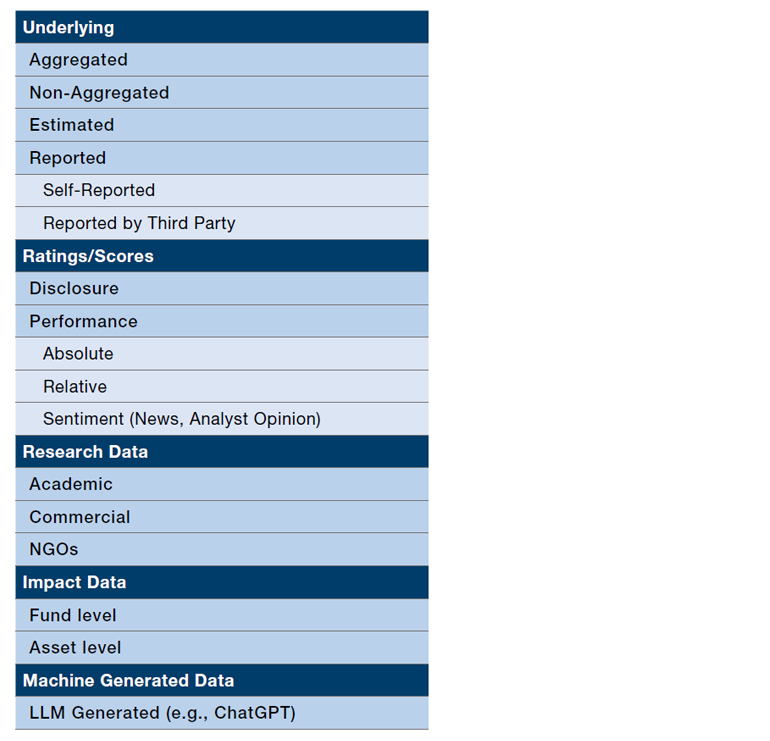
Source: Man Data Science
Another issue is that despite the appearance of more ESG data promoting better insights, most of it is based on opaque models. This makes it hard to integrate it systematically and reliably increase the number of securities for Article 8 and Article 9 funds and complying with SFDR regulations.
ESG data biases and discrepancy between estimated and reported data can significantly affect accuracy and reliability.
The final problem with ESG data is biases which can significantly affect accuracy and reliability:
- Regional bias may occur if data collection methodologies differ across regions or countries, leading to inconsistencies.
- The discrepancy between estimated and reported data can also create bias, as estimates might not fully capture the actual ESG performance of a company.
- Larger countries and companies may have more resources and capacity to report ESG data, which can lead to bias between large and small entities.
- Pillar bias refers to the unequal weighting given to different ESG components - environmental, social, and governance factors - which can skew overall ESG scores and influence decision-making.
Second Challenge: Selecting Data Vendors
The process of data vendor selection requires careful consideration. The first step in this process involves analysing data at a single-stock level. Data experts need to ask themselves: Does this data intuitively make sense? Is it in line with what we know about the company? Are there any glaring inconsistencies or anomalies that raise red flags?
This can be done on a discretionary and systematic level by comparing correlations of similar datasets from different vendors in one industry.
Figure 3 shows an example evaluation of a data vendor selection for fixed income ESG metrics.
Figure 3. Example of Vendor Selection Process
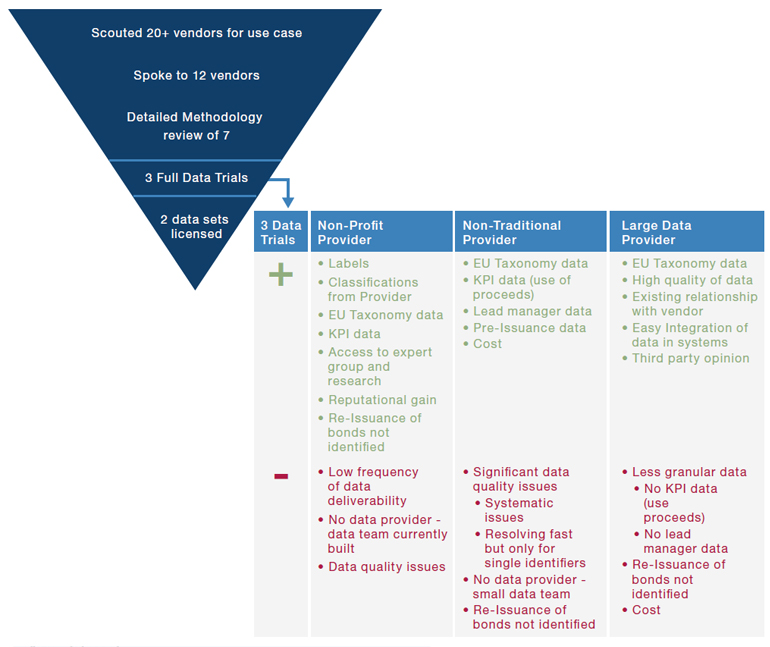
Source: Man Data Science
The second step is to look at the vendor’s methodology: How do they collect their data? What types of sources do they use? Source and collection method heavily influence what can be expected from the data.
One input example is the EU Taxonomy for Sustainable Finance, a framework to establish a common classification system for environmentally sustainable economic activities.
It differs slightly from the SFDR. Where the EU Taxonomy focuses on classifying economic activities as environmentally sustainable, the SFDR is broader in scope and covers both environmental and social aspects of sustainability.
Most companies are not yet reporting on the EU Taxonomy eligibility and alignment. Therefore, if a data vendor only takes as-reported data we expect low coverage (fewer than 30 companies for a portfolio of thousands of companies).
Researchers and data scientist should consider the goal of the project: Is it to achieve the largest possible universe using a combination of estimates and as-reported data? Or do they only want to consider data that has been published by the issuer themselves and has higher accuracy?
To address these challenges, it’s essential to normalise and combine data from different vendors - adjusting the data from different vendors to a common scale and merging data to create a comprehensive dataset.
Is the vendor providing raw ESG data (e.g., as-reported figures on waste recycling and gender statistics). Or is the vendor providing evaluated scores or ranks? This analysis can provide valuable insights into the robustness and reliability of the data.
Furthermore, it’s beneficial to perform a comparative analysis of data quality reports (DQRs) from the different vendors. Coverage, correlations, and distributions can be compared to understand the strengths and weaknesses of each provider. This analysis can help identify the vendors whose data aligns best with specific needs and requirements. It is important to mention here that this is highly dependent on the data use case.
For instance if looking at SDG (United Nation Sustainable Development Goals) data researchers or data scientists need to ask different questions compared to when they are evaluating fixed income classifications.
Often there is a realisation that they cannot rely on a single vendor owing to potential gaps or biases in their data.
A vendor might have extensive coverage of certain industries or regions, but limited coverage of others. They might also have biases in their data due to specific methodology or source selection.
The Solution: Normalisation and Combination
To address these challenges, it’s essential to normalise and combine data from different vendors. Normalisation involves adjusting the data from different vendors to a common scale, while combination involves merging the data to create a comprehensive dataset.
This process has the following benefits:
- First, it can help manage data gaps. If one vendor has limited coverage of a certain industry or region, data from another vendor can be used to fill in the gaps.
- Second, it can help address differences in reported versus estimated data. Different vendors might report different values for the same ESG factor, or they might use different methods to estimate data. Normalising and combining the data can help reconcile these differences and provide a more accurate and comprehensive view of a company’s ESG performance.
Creating a hierarchy of vendors for each datapoint leverages the strengths of each vendor and mitigates the impact of their weakness.
Homogenous datasets, like carbon data, are relatively easy to combine as they share common characteristics. However, heterogenous datasets, like impact data, pose more of a challenge due to their diverse characteristics. This calls for a more nuanced approach.
A useful approach is to create a hierarchy of vendors for each datapoint. For instance, one might use one vendor for as-reported data and another for estimations on metrics. This leverages the strengths of each vendor and mitigates the impact of their weaknesses. It also means unique ESG insights from non-established providers who may lack the necessary infrastructure of enterprise data providers can be included.
The result is a comprehensive and reliable dataset that offers improved coverage and accuracy.
Case Study 1: Carbon
Carbon data serves as a critical metric for assessing a company’s environmental impact. It’s a homogenous dataset, meaning that it shares common characteristics across different vendors. This makes it relatively easy to combine, but it also presents its unique set of challenges.
For instance, different vendors might use different methods to measure and report carbon emissions. Some might focus on direct emissions from a company’s operations (so-called Scope 1 emissions), while others might also include indirect emissions from a company’s supply chain (Scope 2 and 3 emissions).
This can lead to discrepancies and inconsistencies in the data, making it difficult to compare it across different vendors.
By normalising and combining the data from different vendors, researchers and investors can reconcile the differences and inconsistencies in the data and gain a more accurate and comprehensive view of a company’s carbon emissions.
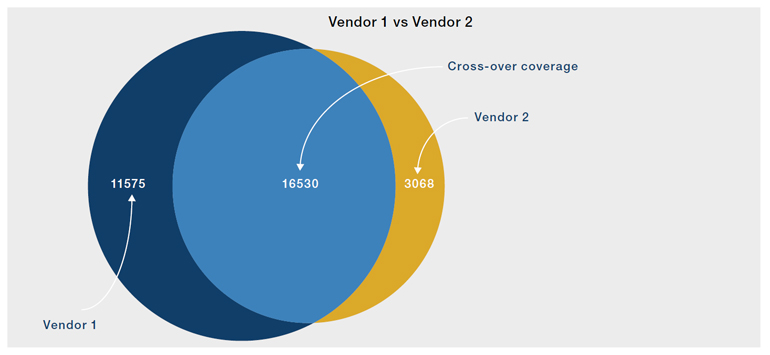
The combined dataset often proves to be better than its individual parts, offering improved coverage and accuracy. Figure 5 illustrates the improved coverage achieved by combining data from multiple vendors.
Figure 4. Combining carbon data provides a more accurate environmental impact picture
Problems loading this infographic? - Please click here
Source: Man Data Science.
Case Study 2: Sustainable Debt
Sustainable debt is a rapidly growing segment of the financial market. It includes green bonds, social bonds, sustainable fixed income and other ESG fixed income securities which are designed to finance projects with environmental and/ or social benefits.
Just like carbon data, there’s variability in coverage and quality depending on the vendor. Established data providers often lack the ESG experience to evaluate issuer-provided labels. However, combining their extensive universe of data with the expertise of niche ESG providers can result in a comprehensive and reliable dataset.
Established data providers offer an extensive universe of data reported by debt issuers (loans/asset-backed securities/bonds). These providers have rigorous and systematic quality controls in place, allowing them to deliver data frequently and in an easy-to-consume manner. For instance, the data is delivered daily, and currency exchange rates are provided at specific points in time.
On the other hand, specialised ESG providers have experts who review a set of debt instruments. They can offer an assurance of the issuer-provided data and data fields that are not delivered by more established providers. However, the data from these niche providers is often less frequently delivered, and they often lack the data infrastructure and quality checks of larger providers.
Combining the high coverage of established data providers with the expertise of specialist ESG providers can create a dataset that is better than the sum of its parts. It offers a unique view on an ESG topic, with high coverage and expert insights.
Figure 5. Combining different datasets better than the sum of its parts
Source: Man Data Science.
The Future: New data combinations
As the ESG data landscape continues to evolve, there is potential to harness non-ESG data for ESG purposes.
As the ESG data landscape continues to evolve, it’s essential to stay ahead of the curve by constantly innovating and exploring new data combinations and methodologies.
Looking ahead, there’s potential to harness non-ESG data for ESG purposes.
- Integrating supply chain data with different ESG themes to gain a more comprehensive view of a company’s indirect impacts and risks.
- Combining news sentiment data with ESG data will help assess how public sentiment towards a company is influenced by its ESG performance.
- Traditional financial data providers will be joined by alternative providers (like NGOs), AI start-ups and publicly available sources (e.g., weather data).
- Performance data could also be combined with ESG fund ratings to establish the relationship between fund performance and granular ESG factors. This could provide valuable insights into the relationship between a fund’s ESG performance and its financial performance, helping investors make more informed investment decisions.
- Future research could also explore the integration of governance data with credit data, ESG data with economic data, and ESG data with sentiment data. These combinations could uncover new insights and trends, helping to drive the evolution of the ESG data landscape.
The Benefits
The benefit from the data science efforts serves investment managers by:
- Significantly increase the investment universe; for instance to trade more high-yield fixed income securities.
- Increase the accuracy of classifications of securities. This feature is essential as it avoids greenwashing which can reduce the risk of costly fines as well as protecting firms from reputational loss.
- Access datasets with more alpha potential that are difficult to integrate for investors due to their complexity.
Conclusion
As we look to the future, the integration of ESG data in investments will not only create a competitive advantage for investment managers, but they also help to transition to a just economy.
In conclusion, the ESG data landscape, while complex and challenging, presents unique opportunities for investors. Through careful vendor selection, data normalisation, and strategic combination, it is possible to unlock the hidden potential in ESG data. The use of robust data science and methodologies can help overcome challenges such as data inconsistencies, biases, and regulatory uncertainties.
By creating comprehensive and reliable datasets, investors can gain valuable insights into the sustainability and societal impacts of a company’s operations. As we continue to innovate and explore this evolving landscape, we can expect to see new methodologies, data combinations, and opportunities that will further empower sustainable and ethical investment decisions. As we look to the future, the integration of ESG data in investments will not only create a competitive advantage for investment managers, but they also help to transition to a just economy.
1. www.opimas.com/research/742/detail/
2. www.ey.com/en_gl/financial-services-emeia/how-esg-data-markets-have-evolved-for-financial-services
3. ec.europa.eu/info/ law/better-regulation/have-your-say/initiatives/12776-Financial-transparency-single-EU-access-point-for-company-information_en
4. www.fca.org.uk/news/news-stories/ we-welcome-consultation-new-code-conduct-environmental-social-and-governance-data-and-ratings
You are now leaving Man Group’s website
You are leaving Man Group’s website and entering a third-party website that is not controlled, maintained, or monitored by Man Group. Man Group is not responsible for the content or availability of the third-party website. By leaving Man Group’s website, you will be subject to the third-party website’s terms, policies and/or notices, including those related to privacy and security, as applicable.