Introduction
China’s meteoric rise since the late 1970s has turned it into a major economic player on the international stage. However, its domestic China A-share market has largely sat on the sidelines of global capital markets until recently and is still vastly underrepresented in global portfolios. Elevated volatilities, limited foreign access and incomplete market mechanisms (e.g. lack of shorting and financial derivatives) – issues which have long deterred global investors from investing in China A – have gradually improved in the recent years as a result of the Chinese government’s reform efforts and an increasing participation of offshore investors via the Stock Connect program. We believe the market is now a compelling investment opportunity for foreign investors looking to diversify their portfolio from both beta and alpha perspectives.
We have previously discussed how Chinese assets have acted as a diversifier over the last decade; to map out how big Chinese assets could become in global markets in the event that somewhat arbitrary caps on exposure are lifted over time; to look at the current levels of underexposure; and to address the opportunity for extracting alpha from Chinese equities.
In this article, we argue that investors should not only consider viewing China A as a distinct asset class, but also a potentially rich and diversifying universe for alpha generation. Onshore China is probably the last market to open its doors to foreign investors that offers the following combination of attributes: inefficiency, diversity, liquidity and abundance of information.
Following Grinold’s fundamental law of active management, the value add of an investment strategy depends mostly on three factors:
- Breadth: the number of independent bets the manager can make to realise her return predictions;
- Skill: the strategy’s ability to predict excess returns; and
- Transfer coefficient or implementation: the manger’s ability to translate her return predictions into portfolio bets in the face of portfolio construction constraints.
The China A-share market, thanks to its size and domestic-oriented investor base, provides a fertile ground for alpha generation on the basis of both breadth and skill. It is also quickly catching up on market infrastructure and accessibility, and in our view, provides potential opportunities for investment managers to boost their transfer coefficients.
Breadth
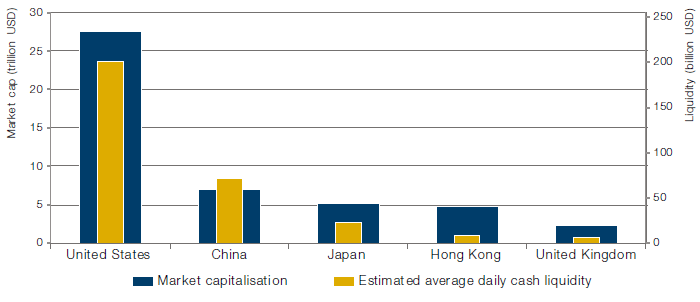
Since being established in 1990s, the China A-share market has experienced tremendous growth and claimed the spot as the second-largest national equity market in the world (measured by market capitalisation), only next to the US (Figure 1).
Figure 1. Equity Markets by Market Capitalisation
Source: Bloomberg; as of 31 March 2020.
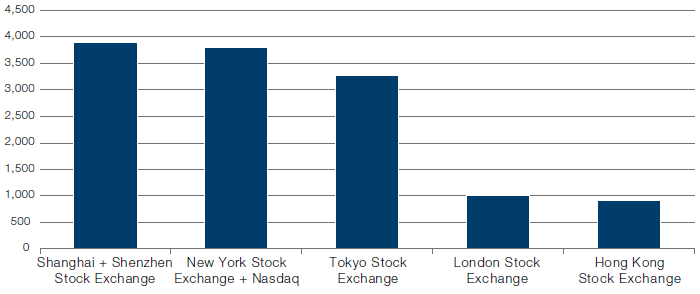
If we look at the number of stocks listed on major exchanges1 (Figure 2), the China A-share market (Shanghai Stock Exchange and Shenzhen Stock Exchange combined) has surpassed the US (NYSE and NASDAQ combined). This is particularly impressive given its short history and rather stringent IPO regulations.2
Figure 2. Number of Stocks
Source: Man Numeric; as of 31 March 2020.
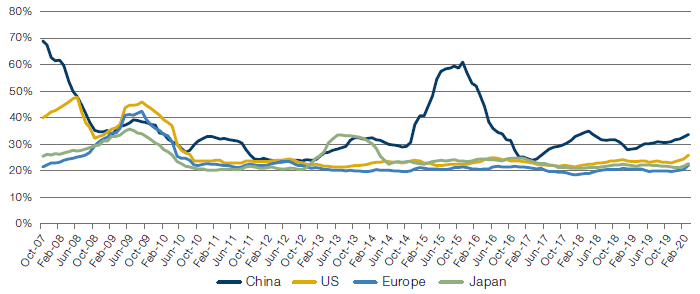
It can be argued that the number of stocks is only a very rough measure of breadth – in the end, active managers need stocks that don’t move together to maintain the relative independence of their bets. Cross-sectional volatility, a measure of return dispersion, could be a better proxy for effective breadth. Contradictory to some investors’ impressions – that the retail dominant China-A market with frequent heavy government interventions would exhibit a herding effect and the potential for stocks moving in the same direction – the China A-share market has actually historically provided the biggest return dispersion, and hence the biggest opportunity set, compared with the US, Europe and Japan3, when it comes to stock selection strategies (Figure 3).
Figure 3. Return Dispersion (Annualised) by Region
Source: Man Numeric; as of 31 March 2020.
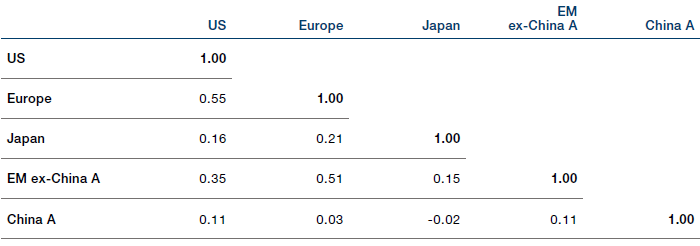
The significant breadth of the China A-share market warrants its treatment as a stand-alone investment universe for active managers. Moreover, including China A-share stocks in existing strategies’ investment universe can add much more than just a larger universe. It’s widely recognised that the major equity markets in the world have not only increasingly moved together in recent years, but also exhibited more homogeneous underlying investment environments, significantly damping the breadth of active managers’ investment universe and squeezing the geographical diversification benefits. For example, a value-oriented manager might be disappointed if she relies on her strategy’s strength in Europe when value is struggling in the US. As shown in Figure 4, the monthly return correlations of value4 between the US and Europe is almost 60%. However, given that China A is not correlated with any other major investment universe, she could expect significant diversification benefits when adding China A stocks.
Figure 4. Monthly Return Correlations, Barra Value
Source: MSCI, Man Numeric; August 2005 – March 2020.
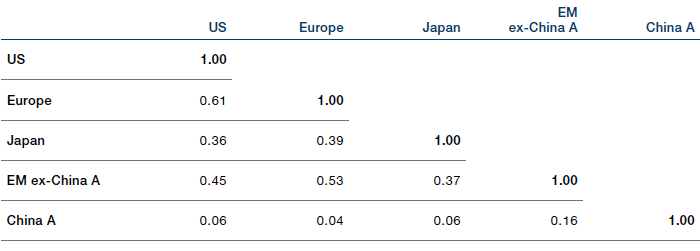
Looking beyond value, if we use the returns5 of major Barra style factors (Value, Momentum, Volatility, Leverage, Size, Liquidity, Growth) as proxies of the general investment environment, China A tends to exhibit an orthogonal market condition. As seen in Figure 5, the average return correlations of the seven Barra style factors are the lowest for the China A-share market. The economic globalisation and the interaction of national monetary policies, combined with the integration of investment management industries worldwide, have reduced the cross-regional diversification benefits. Equipped with a domestic-oriented fiscal and monetary policy, a unique investor base and a still largely isolated capital market, China A-share, at least in the near future, could provide additional investment breadth for investors, when it is most needed.
Figure 5. Monthly Return Correlations, Average
Source: MSCI, Man Numeric; August 2005 – March 2020.
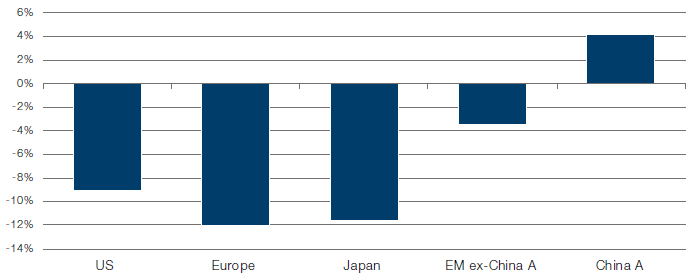
As the outbreak of Covid-19 sent global markets into the most pronounced selloff (since the Global Financial Crisis) in March 2020, systematic active equity managers faced enormous challenges from the simultaneous extreme factor performance across regions. As shown in Figure 6, value companies, typically more levered and therefore exposed to default risk, underperformed in the US, Europe, Japan and, to a lesser extent, EM ex-China A, as the widely adopted stay-at-home measures elevated corporate default risk to an unprecedented level. The magnitude of the monthly spreads in these regions was nothing short of remarkable. However, value companies in China A held up and gained more than 4%.
Figure 6. Barra Value Performance
Source: MSCI, Man Numeric; March 2020.
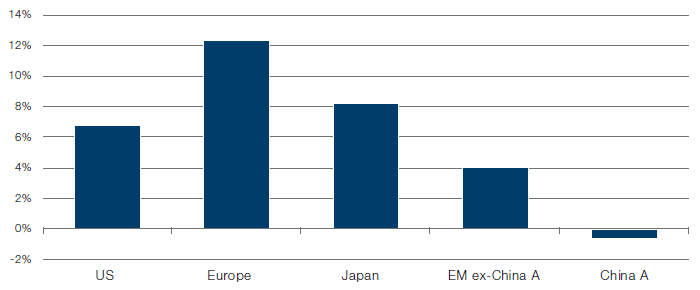
On the flip side, Barra Momentum (Figure 7) in the US, Europe, Japan and EM ex-China A posted extremely strong returns in March, with a spread magnitude comparable to Barra Value. Again, Barra Momentum in China A exhibited a different payoff profile amidst such an extreme environment. The unique factor payoff profile in the recent market turmoil further testified to China A-share’s potential diversification benefits.
Figure 7. Barra Momentum Performance
Source: MSCI, Man Numeric; March 2020.
Skill
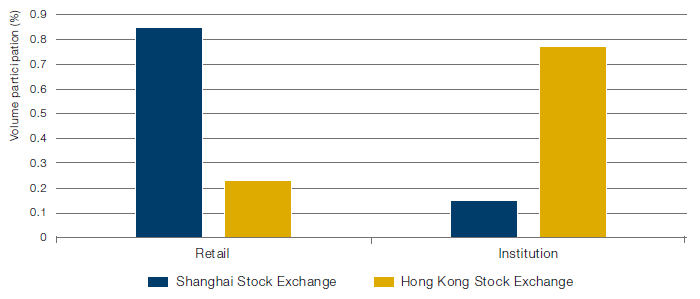
As important as breadth is, the skill to predict exceptional return is always the single most important factor that determines an investment manager’s edge. Even after the rapid development of the domestic institutional investment management industry and increasing foreign participation, the China A-share market is still largely dominated by retail investors. Academic research6 has shown that while wealthy retail investors tend to rely on traditional investment principles (book-to-price and momentum), less wealthy retail investors favor high-beta, low price, low earnings and underperforming stocks. And with limited access to offshore investments and attractive yields on credit products, the equity and real estate markets are often the only release valve for retail investors. While the high retail participation can potentially lead to heightened volatility (as witnessed in the summer of 2015), it also has the potential to create significant mispricing in the market and be exploited by skilled active participants seeking to generate alpha.
Figure 8. Trading Volume – Retail Versus Institutional
Source: SSE, HKSE; average over 2013-2019.
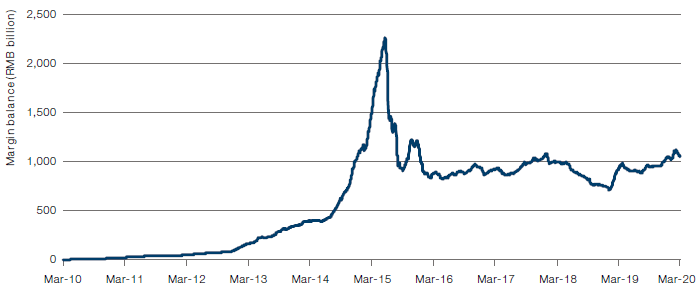
Retail investors tend to exhibit certain behavioral biases, such as herding. Figure 9 shows the outstanding margin trading balance of retail investors, which clearly follows the market cycle – and thus exacerbates excess market volatility, creating potential risk for investment managers.
Figure 9. Retail Margin Balance
Source: SSE, SZSE; as of 31 March 2020.
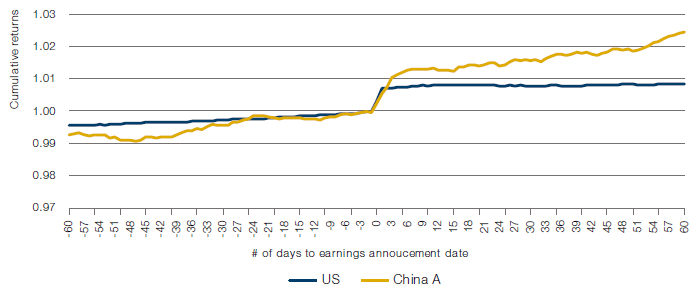
However, in the meantime, persistent behavioral biases of investors have also resulted in market inefficiency. First documented by Ball and Brown in 1968, post-earnings announcement drift (‘PEAD’) is a well-known anomaly and indicator of market inefficiency as a result of investors under-reacting to earnings surprises. As market efficiency improves, PEAD has largely disappeared. This can be seen in major developed markets, especially in the US. As shown in Figure 10, almost all cumulative returns of earnings surprise happen exactly on the earnings announcement date – there is no abnormal price move leading to the earnings announcement date, nor is there price drift after the earnings event. In comparison, the average stock price keeps drifting upwards for at least two months after the positive earnings surprise in the China A-share market, yielding a sizable alpha opportunity for active investment participants.
Figure 10. Post-Earnings Announcement Drift
Source: IBES, Man Numeric; between 1 January 2014 and 31 March 2020.
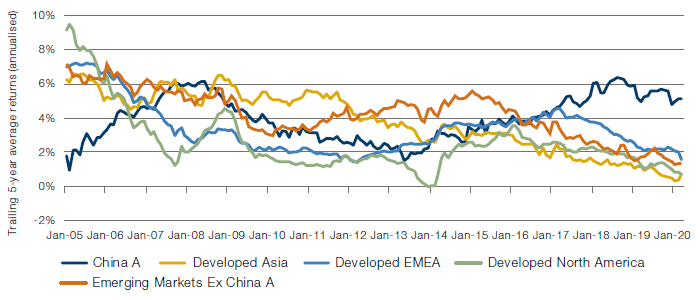
Traditional quant factors have been struggling in recent years, spurring the discussion as to whether such well-known factors can continue to deliver values for investors in an increasingly efficient market environment. In Figure 11, leveraging a commercialised alpha library, we build a simple generic composite alpha signal comprising of 40% value, 30% momentum and 30% quality, and evaluate its performance in various investment universes over time.
The trend is clear – this generic composite alpha’s efficacy clearly decays universally in all regions except China A. It is unlikely that the China A-share market can defy the gravity of market efficiency in the long run. However, when most quantitative managers worry about their factors’ crowdedness in the rest of the world, those investing in China A might even have the luxury of a tailwind from the gradual institutionalisation process.
Figure 11. Composite Alpha’s Efficacy Decays Everywhere Except in China A
Source: S&P, Man Numeric; between 1 January 2000 and 31 March 2020.
It goes without argument that it takes more than just generic factors to deliver alpha. Any active manager, quantitative or fundamental, relies on information that is not generally available to gain the investment edge. With a large domestic broker community and a unique regulatory requirement, it is possible to improve investment processes by leveraging the abundant local insights from both domestic sell-side communities and sophisticated investors.
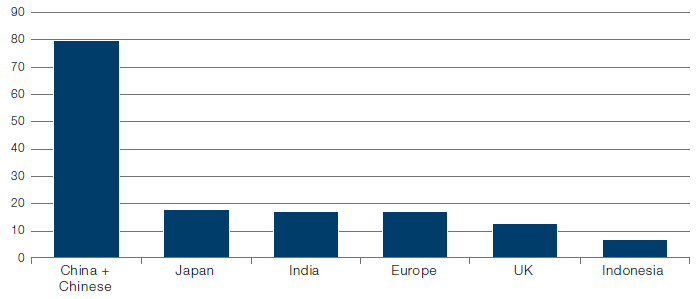
Beyond traditional information sources, the China A-share market is also an alternative data-rich market thanks to China’s vast size and booming e-commerce sector. Figure 12 is a cursory look at country breakdown of alternative datasets on one of the leading alternative data platforms – China A clearly leads all other non-US markets by a wide margin. At Man Group, we have applied web scraping and Chinese-based natural language processing to extract unconventional investment insights.
Figure 12. Data Categorisation by Non-US Regions
Source: Eagle Alpha; as of 5 December 2019.
Implementation
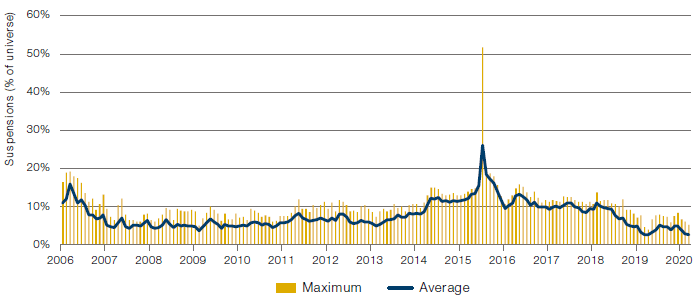
China A has been notorious for various practical hurdles for active managers to effectively implement their investment strategies, one of which is suspension. Historically, Chinese-listed companies tend to suspend the trading of their stocks to avoid unfavourable price moves, sometimes even arbitrarily. In Figure 13, we plot the time-series of the suspension ratio of the China A-share market. The suspensions peaked in late 2015 and early 2016 amidst the market turmoil and a brief introduction of circuit break mechanism. Since then, the suspension issue has improved, driven by efforts from domestic regulators as well as pressure from leading index providers. When the market opened down 8% following the extended lunar New Year holiday and coronavirus outbreak in early February 2020, we were pleased to see no suspensions.
Figure 13. Suspension Ratios
Source: Man Numeric; between 1 January 2006 and 31 March 2020.
Conclusion
With the abundance of breadth, inefficiency, local information and increasingly fewer implementation hurdles, we believe investing in the China A-share market can potentially benefit active managers looking to explore new alpha sources or diversify their existing strategies. In the meantime, the unique market dynamic, retail dominant investor base and the language barrier for leveraging local information pose significant challenges. As such, we believe investors should view China A-shares as a separate asset class, requiring dedicated research resources and allocation.
1. Given there are only Chinese stocks listed in China A-share market, we only count stocks that are listed in their principle country of risk.
2. Chinese companies still need to obtain permissions from China Securities Regulatory Committee’s permission to go public.
3. Numeric-defined China A, US, Europe and Japan universe.
4. Measured by monthly inter-quintile spreads of Barra Value factor.
5. Measured by monthly inter-quintile spreads.
6. Ng and Wu, Revealed Stock Preferences of Individual Investors: Evidence from Chinese Equity Markets, 2006.


You are now leaving Man Group’s website
You are leaving Man Group’s website and entering a third-party website that is not controlled, maintained, or monitored by Man Group. Man Group is not responsible for the content or availability of the third-party website. By leaving Man Group’s website, you will be subject to the third-party website’s terms, policies and/or notices, including those related to privacy and security, as applicable.