The Fire and Ice Debate
Some say the world will end in fire; Some say in ice. From what I’ve tasted of desire I hold with those who favor fire But if it had to perish twice, I think I know enough of hate To know that for destruction ice Is also great And would suffice
In the late 1990s two luminaries of the Morgan Stanley research department engaged in a debate that set the agenda for the macro conversation for years to come, and which is as relevant today as it was then. On one side of the debate, the great and sadly now much missed Barton Biggs posited that the world would freeze over as a glut of cheap Asian labour hit the world market; on the other, the brilliant Steve Roach, then the firm’s chief economist, now a senior fellow at Yale, pointed to the Philips Curve and public deficits in the west, and predicted an inflationary bonfire. They called the debate Fire and Ice, inspired by the Robert Frost poem:
The Stock-Bond Correlation
Why does this matter now? Well, stocks and bonds are behaving very strangely these days and watching their interaction can potentially tell us a lot about the inflation regime. For nearly the last 20 years, since 1998, stock prices and bond prices have been negatively correlated – meaning, obviously, that when stock prices go up, bond prices go down and vice versa. With both stocks and bonds currently at or very near all-time price highs it may seem counter-intuitive to say that they are acting in opposition to each other, but broken into short periods that is what we have seen.
For example, from June 2015 to June 2016 stocks fell and bonds rallied. Then, after June 2016 the reflation trade was on, equities rallied and bonds fell. There was a negative stock-bond correlation throughout both periods.
Breaking a 250 Year Relationship
To show how unusual this is we can call on data from Matt Roberts-Sklar at the Bank of England in the excellent Bank Underground blogsite. He has shown, using data-sets spliced together from various sources, that in the UK at least, stocks and bonds moved up and down together throughout the 250 years prior to the start of this century! Chart 1 below shows this via the ten year rolling correlation of UK consols (perpetual bonds first issued in 1752) and equities. What is immediately clear is that there has never previously been a period when equities and bonds acted inversely to each other in all of that time – until recently.
Historical Precedent
There are interesting clues in these data too. Particularly of note are the only two extended periods when the stock-bond correlation fell close to zero, namely 1803-1821 and 1861-1895. (It also briefly approached zero for a few months in 1974 but this was a highly unusual period brought on by an extreme exogenous shock, namely the Yom Kippur war and first oil crisis of 1973 – the FTSE hit a trough valuation of 2.9x earnings and the pension funds were directly ordered by the Heath government to buy equities. Immediately post the shock the stock bond correlation quickly went back to new highs as inflation accelerated.)
Chart 1. Stocks and bonds correlation, GB/UK, 1764-2017. Breaking a 250-year relationship
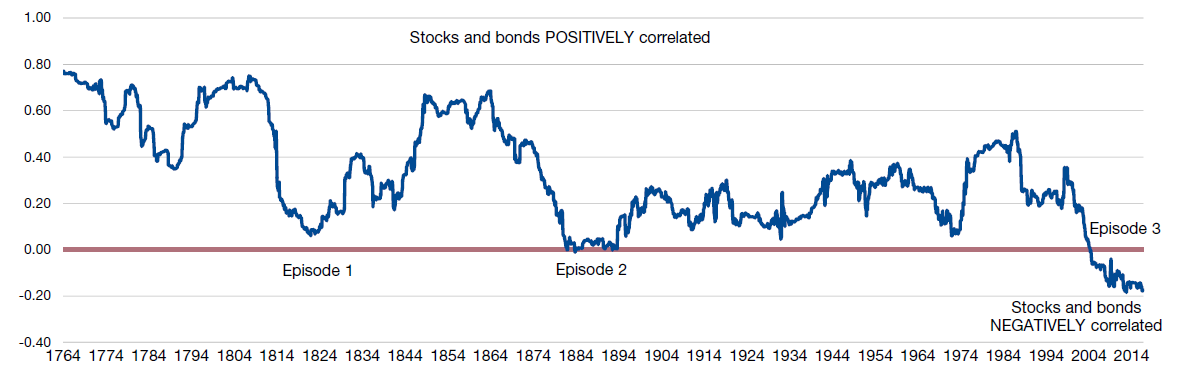
Source: Man GLG, Thomas and Dimsdale (2016) and Bank of England. Line shows ten-year trailing correlation of monthly returns on UK equities and consols. See Matt Roberts-Sklar in Bank Underground: https://bankunderground.co.uk/2016/10/20/bitesize-250-years-of-the-bond-equity-correlation/
What are the similarities between those 19th century episodes and the last 15 years? Table 1 below shows summary statistics.
In all cases inflation decelerated and bond yields fell, and in all cases bond yields fell to below prevailing trend nominal GDP growth. Furthermore in all three cases the peak positive stock bond correlation roughly coincided with the peak of the yields, but importantly the trough in the stock bond correlation occurred almost exactly on the trough in the bond yield. In other words, as bond yield fell from high or relatively high levels, the stock bond correlation fell and as bond yields troughed out the stock bond correlation troughed. Now these are just three episodes but it does seem crystal clear from the trends that, historically, higher bond yields equated to a positive stock bond correlation and lower bond yields to a lower or zero or even negative stock bond correlation.
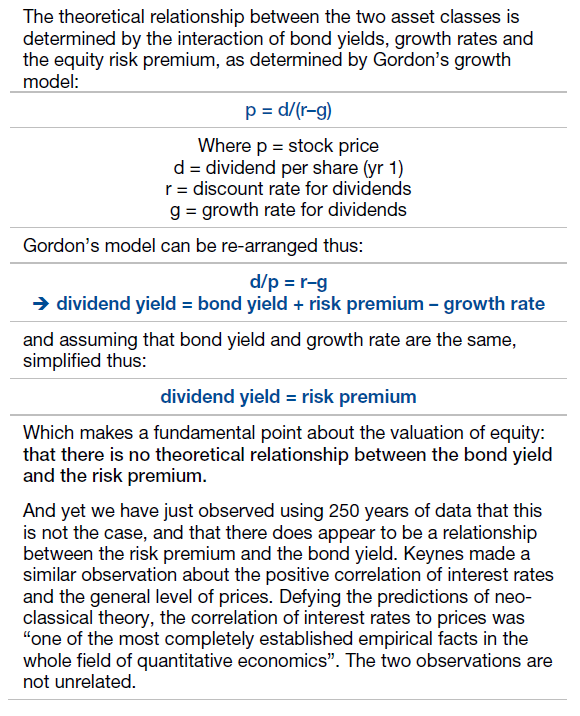
So it works in 250 years of practice, but does it work in theory?
Many serious people argue that there is or should be no relationship between bond yields and equity valuations – and therefore no structural correlation between stocks and bonds.
For our simplified take on the theory of this, see table 2.
Table 1. Three episodes of stock-bond de-coupling in the UK in 250 Years
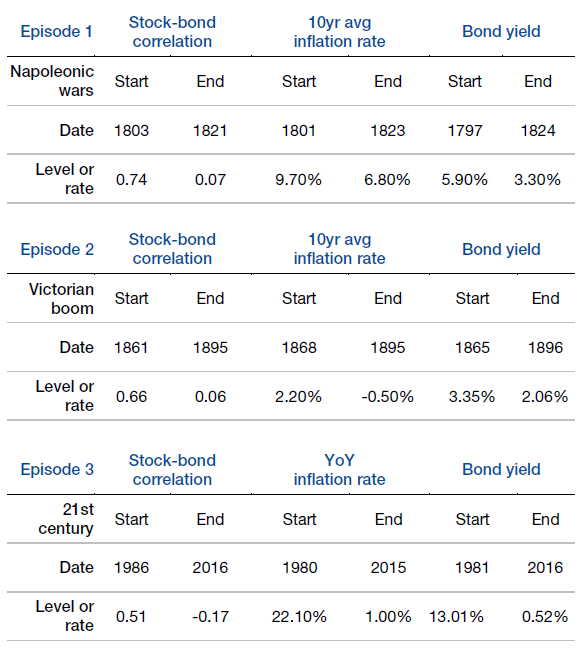
Sources: Janssen, Nolan, Thomas (2002) "Money, Debt and Prices in the UK"; Mitchell (1988). "British Historical Statistics"; Office of National Statistics; Roberts-Sklar, M. Analysis by GLG Partners LP.
Table 2. ‘Should’ stocks and bonds be correlated?
Visualising the Stock-Bond Correlation
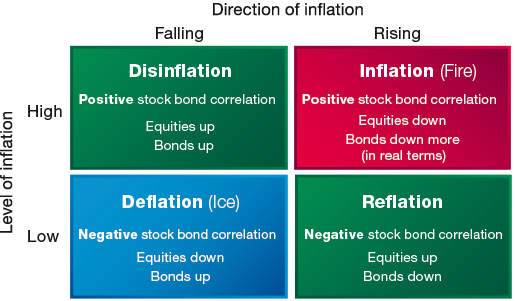
Our simple view is that regardless of whether there is theoretical support for a predictable stock-bond correlation, there is substantial empirical support, and we feel the empirics can quite easily be rationalised. We have attempted a visualisation of this in chart 2 “Fire and ice”.
Start in the top left quadrant and work clockwise. We are in the Disinflation zone, with high but falling inflation – think 1980, Paul Volcker and 20% policy interest rates. Future inflation expectations fall with high current real interest rates. Less inflation means more real return to bond and equity holders: both asset classes rally. There is a strong positive correlation as markets price out inflation.
Then at a certain point, as inflation falls, markets switch from pricing out inflation to pricing in deflation. Deflation is terrible for equities (as we saw in 2008), and perfect for bonds. The stock-bond correlation switches from positive to negative.
Central banks and other policymakers then attempt to stimulate the real economy, rates are cut, QE is enacted, fiscal policy is eased. Eventually, inflation expectations stop falling and start rising. Bond prices fall and equity prices rise. We are in the Reflation zone. The stock-bond correlation is still negative, but the directions have been switched as the market prices out deflation by pricing in a little inflation.
Which is all very nice until the market starts to contemplate not a little but a lot of inflation. As we move from the Reflation zone to the Inflation zone, the stock-bond correlation flips back to positive, and everything goes down in real terms even if not in nominal terms – there’s a lot of inflation. We are back in the 1970s, and Volcker needs to be re-appointed!
Chart 2. Fire and ice
Implications for equity portfolios
So much for the theory; what does this mean for equity portfolios? We would highlight the following:
- In our view inflation may well accelerate around the world as the policy focus shifts from monetary to fiscal easing. Monetary easing is generally good for asset prices. Fiscal easing is good for nominal GDP in the short run (1-3 years).
- As this happens, we believe that the stock-bond correlation will eventually flip from negative to positive.
- We think that the level of bond yield at which this happens will be around the trend growth rate of nominal GDP. What that level is we cannot know – for the US somewhere between 3 and 4% seems fair to us – between 1 and 2% real GDP growth, 2% inflation is reasonable.
- We believe that until the US ten year is in that 3-4% range, we should welcome rising bond yields and accelerating inflation.
- We would therefore be inclined towards a Value driven portfolio which seeks to avoid higher valuation, DCF valued stocks.
Data Sources and other references
Broadberry, S N and van Leeuwen, B (2010), ‘British economic growth and the business cycle, 1700-1870: annual estimates’, Department of Economics, University of Warwick, available at http://www2.warwick.ac.uk/fac/soc/economics/staff/academic/broadberry/w…. (Please contact the authors directly for these data)
Boyer G R and Hatton T J (2002), 'New estimates of British Unemployment, 1870-1913', Journal of Economic History (62), pages 643-75.
Capie, F and Webber, A (1985), A Monetary History of the United Kingdom, 1870-1982, Volume 1, Routledge.
Catão, L V and Solomou, S N (2005), ‘Effective exchange rates and the classical gold standard adjustment’, American Economic Review, 95(4), pages 1259–75.
Collins, M (1986), ‘Sterling Exchange Rates, 1847-1880’, The Journal of European Economic History Vol. 15, No. 3, pages 511-33
Crafts, N F R and Mills, T C (1994), ‘Trends in real wages in Britain, 1750-1913’, Explorations in Economic History, Elsevier, Vol. 31 (2), pages 176-94.
Cuenca Esteban J (1997), ‘The rising share of British industrial exports in industrial output, 1700-1851’ The Journal of Economic History, Vol. 57, No. 4, pages 879-906.
Deane, P (1968), ‘New estimates of Gross National Product for the United Kingdom 1830-1870’, The Review of Income and Wealth, Vol. 14 (2), pages 95-112.
Dimsdale, N H (1981), ‘British monetary policy and the exchange rate 1920-38’, Oxford Economic Papers, Supplement.
Domit, S and Shakir, T (2010), ‘Interpreting the world trade collapse’, Bank of England Quarterly Bulletin, Vol. 50, No. 3, pages 183-89.
Feinstein, C H (1972), National income, output and expenditure of the United Kingdom 1855-1965, Cambridge: Cambridge University Press.
Feinstein, C H and Pollard, S (1988), Studies in capital formation in the United Kingdom 1750-1920, Clarendon Press.
Janssen, N, Nolan, C and Thomas, R (2002), ‘Money, debt and prices in the United Kingdom’, Economica, Vol. 69, No. 275, pages 461-79.
Lewis, W A (1981), ‘The rate of growth of world trade, 1830-1973’, in Grassman, S and Lundberg, E (eds), The World Economic Orders: Pasts and Prospects. Palgrave Macmillan.
Middleton, R (1996), Government versus the Market, Edward Elgar.
Mitchell, B R (1988), British Historical Statistics, Cambridge University Press.
Mitchell J, Solomou S N and Weale M (2009), ‘Monthly and quarterly GDP estimates for interwar Britain’, NIESR Discussion Paper no. 348, National Institute of Economic and Social Research.
O'Donoghue J, Goulding L and Allen G (2004), "Consumer Price Inflation since 1750", ONS Economic Trends 604, March 2004.
Officer, L H (1996), Between the dollar-sterling gold points, Cambridge University Press.
Sefton, J and Weale, M (1995), Reconciliation of National Income and Expenditure: balanced estimates of national income for the United Kingdom,1920-1990, Cambridge University Press.
Solomou, S N and Vartis, D (2005),Effective exchange rates in Britain, 1920-1930’,The Journal of Economic History, Vol. 65, No.3, pages 850-59.
Solomou, S N and Weale, M (1991), ‘Balanced estimates of UK GDP 1870-1913’, Explorations in Economic History, Vol. 28, No. 1, pages 54-63.
You are now leaving Man Group’s website
You are leaving Man Group’s website and entering a third-party website that is not controlled, maintained, or monitored by Man Group. Man Group is not responsible for the content or availability of the third-party website. By leaving Man Group’s website, you will be subject to the third-party website’s terms, policies and/or notices, including those related to privacy and security, as applicable.