Introduction
Bond markets have started to price in prospects for higher growth and inflation, anticipating re-opening economies, rampant fiscal stimulus, and dovish central banks. Indeed, nominal 10-year rates in the US have risen by well over 100 basis points since their low in 2020; 10-year inflation breakevens by even more; and most recently, real 10-year rates, i.e., nominal 10-year rates minus implied inflation, while still negative, have started to rise too (Figure 1).
Figure 1. US 10-Year Nominal Yield, Real Yield and Implied Inflation
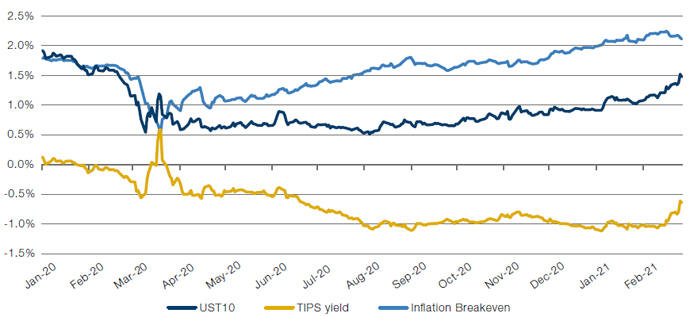
Source: Bloomberg; as of 31 March 2021.
Higher Rates + Inflation = A Problem for Markets?
This raises the question: at what point do higher rates and inflation become a problem for markets?
In summary, we believe that rates are still well below any problematic level for any investment horizon of one year or longer; that inflation – while not a problem yet – could become a problem more quickly than most currently expect; and that the 3- to 6-month outlook for risky assets is less good than normal, in part as a result of the recent rapid rate rises.
We believe that rates, at these levels, are very far from being the cause of the end of the equity bull market.
Rates are still very low and far from being restrictive. Economic cycles – and equity bull markets – tend to end through overheating and overtightening. We believe that rates, at these levels, are very far from being the cause of the end of the equity bull market. Pre-quantitative easing, the old rule of thumb used to be that rates, in equilibrium, should be roughly equal to trend GDP growth. Rates below this equilibrium are consistent with easy policies, while rates above that equilibrium spell trouble. On that measure, rates are still very low. Most people expect real trend GDP growth in the US to be at least 1%, courtesy of working-age population plus some productivity growth. Figure 2 illustrates the same point for global nominal rates.
Historically, PE multiples start to contract when inflation exceeds 3%, but not before. History can inform us when higher inflation becomes a problem, empirically. From historical analysis of US data since 1958 we can deduce that up to 3% inflation is typically not a problem, in isolation, for equity multiples, but above and beyond 3% inflation PE multiples start to contract (Figure 3).
Figure 2. Global Bond Yields Are Still Well Below Trend GDP Growth
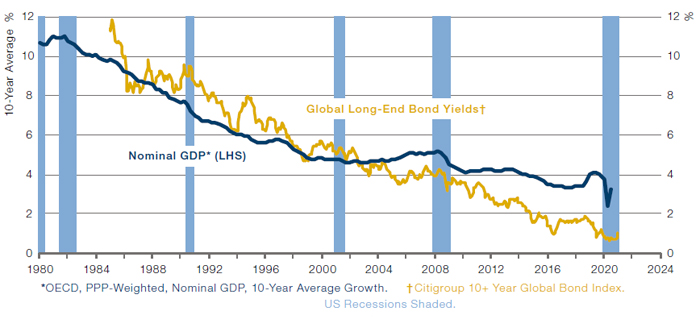
Source: Minack Advisors; as of 31 March 2021.
Figure 3. US PE Versus CPI
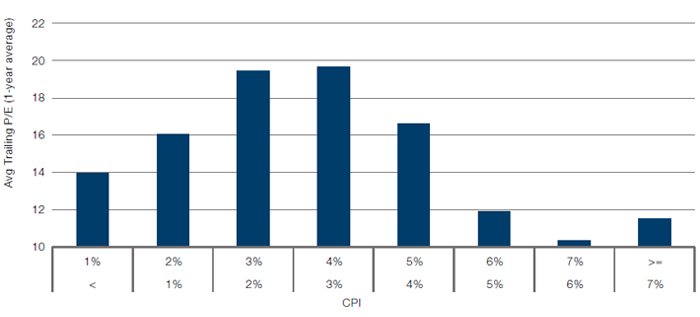
Source: Morgan Stanley; as of 31 March 2021.
The recently published Credit Suisse Yearbook sheds further light on this question, using annual data for 21 countries starting in 1900. Using data for inflation, real bond return and real equity return, the authors observe that average real equity returns were positive even for surprisingly high readings of inflation: Figure 4 shows, for instance, that average real equity return reached 6.3% when inflation was as high as between 4.1% and 7.5%.
Figure 4. Real Bond and Equity Returns Versus Inflation Rates, 1900-2020
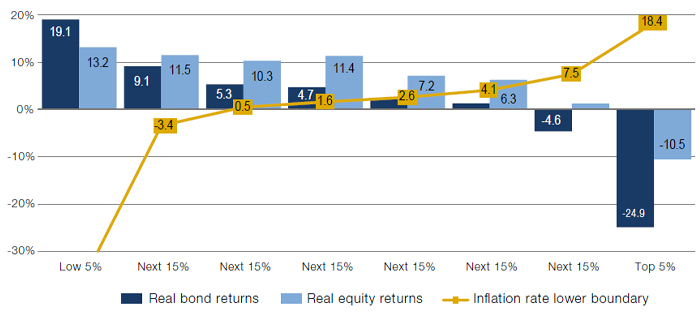
Source: Credit Suisse Global Investment Returns Yearbook 2021; as of 31 December 2020.
One might draw comfort from this and conclude that equity holdings need not be reduced due to higher inflation fears, or in any case not quite yet. However, we believe that would be false comfort. Our Fire & Ice framework – familiar to our regular readers – looks not only at the level of inflation, but considers the direction of inflation, too. This, we believe, is a critical nuance in any analysis of the impact of inflation on equity returns.
For instance, let’s contrast 1982 and 1973. In 1982, US CPI was on its way from high to moderate and fell from 8.9% to 3.8%, and the S&P 500 Index went up a nominal 15% that year; nine years earlier, in 1973, US CPI went exactly the other way and rose from 3.4% to 8.7%, while the S&P 500 fell by a nominal 17%! Identical levels of inflation, but opposing direction of change, with a completely different outcome for equities.
Our new academic study The Best Strategies for Inflationary Times confirms this finding with new long-term data. We observe that rising inflation when inflation is above the historical mean of 2.6% is hurtful for equities, historically. We identified 34 episodes of inflation since 1926 in the US, UK and Japan. These episodes are defined as inflation peaking above 5% – only three of these episodes happened after 1990. On our definition, these episodes lasted on average about two years, and at the start of these episodes inflation tended to be below 3%. We find that real equity returns are negative across these 34 episodes. We conclude that periods of rising inflation to levels of 5%+, even at seemingly low-ish levels of inflation, have historically been bad for equities.
We may in fact be closer to the point that rising inflation becomes a problem than many think.
And most of all, our mantra: stock-bond correlations will be the market’s tell! We conclude that we may in fact be closer to the point that rising inflation becomes a problem than many think; and that investors are well-advised to monitor closely whether we are entering the inflationary quadrant of our Fire & Ice regime. The best way to observe that this is happening is when the stock-bond correlation turns positive, i.e., when stock markets and bond markets display positive, or negative performance, simultaneously. That would be akin to the market telling us that inflation is now the major threat to the investment climate, as opposed to deflation which has been the major threat for over 20 years now.
Rates may still be low, but the rate of change has been so rapid that near-term risks have risen. We follow a disciplined framework to inform our discretionary decisions, and some of our models flag heightened tactical risk, precisely because the rapid move up in rates recently. For instance, there are current sell signals from both our Composite Valuation Indicator and our Composite Market Timing Indicator for equities versus bonds in Europe and Japan. This does not equate to an automatic sell signal, especially not in an early-cycle bull market like we judge we are currently in, but it does show that markets are more fragile than usual. Some near-term caution seems appropriate also if you judge a bunch of recent sentiment indicators, with for instance the recent Bank of America Merrill Lynch Fund Manager Surveys one of the most bullish there has ever been.
This set-up points to above average near-term risks for equities, a preference for Value over Growth, and higher 10-year rates.
The Federal Reserve’s predicament is a case in point. It seems to us that the Fed is somewhat between a rock and a hard place. On the one hand, if the Fed continues to not intervene to stem the ever rising rates and steepening curve – the most likely outcome in our view – then long rates could continue to rise and test the Fed’s resolve. This situation, we believe, could persist until 0% real 10-year rates are approached, as we judge that the Fed is most keen to keep real rates negative. On the other hand, if the Fed starts talking about raising rates so as to contain the impression it is behind the curve – not very likely in our view at this point – then the entire curve moves up as a new Taper Tantrum manifests itself.
Market Implications
We conclude that this set-up points to above average near-term risks for equities, a preference for Value over Growth, and higher 10-year rates. And most of all, we are highly vigilant in monitoring when the benign reflationary market environment morphs into the malign inflationary climate.
Figure 5. Europe Combined Market Timing Indicator (LHS) and Composite Valuation Indicator (RHS)
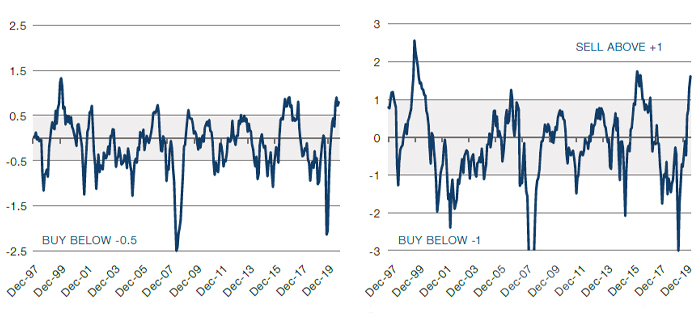
Source: Man Group; as of 31 March 2021.
You are now leaving Man Group’s website
You are leaving Man Group’s website and entering a third-party website that is not controlled, maintained, or monitored by Man Group. Man Group is not responsible for the content or availability of the third-party website. By leaving Man Group’s website, you will be subject to the third-party website’s terms, policies and/or notices, including those related to privacy and security, as applicable.