Introduction
The way investors thought about hedging inflation changed dramatically in 1977. Until then, it had been broadly accepted that equities provided decent protection against the damaging impact of inflation on portfolios’ real returns. But then Eugene Fama and William Schwert published a paper, titled Asset Returns and Inflation in which they showed that US equities were a “perverse” hedge on inflation, and far from protecting portfolios, actively harmed them during periods of rising prices. It feels like we are reaching a similar tipping point in the perception of property as an inflation hedge. There has been, it seems, a kind of thoughtless acceptance of the fact that property provided protection against inflation, being, at least theoretically, a ‘real’ asset.
Now that assumption is being held to significant scrutiny. In this article, we seek to look in depth at the performance of property during periods of inflation, while urging investors to recognise that it may be that thinking about national property markets and their interaction with economic conditions requires a level of nuance and specificity that few in the academic community have applied thus far.
Overthrowing Received Thinking
What is often assumed to be a fairly straightforward relationship – that property provides an effective hedge against inflation – is actually more complex.
A recent paper by my colleagues entitled The Best Strategies for Inflationary Times (2020) looked at the long-term historical relationship between a number of assets classes and inflation. One of their findings was that what is often assumed to be a fairly straightforward relationship – that property provides an effective hedge against inflation (i.e., house prices go up during inflationary periods) – is actually more complex. In fact, with a 1% real return during times of inflation and a 3% real return during all other periods, UK real estate is relatively unaffected by inflation, particularly when compared to financial assets. Figure 1 shows the performance of real estate in the UK in inflationary periods in the past century.
Figure 1. Performance of UK Real Estate in Inflationary Periods in the Past Century

Source: Man Group; as of 31 March 2021.
The picture in the US was even starker, with US residential property returning -2% in periods of inflation, while delivering positive 2% returns at all other times. The findings of this research seem to go against a number of previous academic studies. For instance, Gyourko and Linneman (1988), Bond and Seiler (1998), and Sing and Liow (2000) concluded that house prices provide a hedge against both expected and unexpected inflation. Anari and Kolari (2002) examined the impact of inflation on homeowner equity by investigating the relationship between house prices and the prices of non-housing goods and services and concluded that US house prices have provided a stable inflation hedge for the period between 1968 and 2000. The Man Group findings appear to us both more robust and more comprehensive than these previous studies, leaving us asking whether we should discard the idea of property as an inflation hedge altogether.
Finer Details
In discarding property as a potential hedge for inflation en gros, we risk making the same mistake as those who post-1977 threw the babies of trend-following and momentum strategies out with the bathwater of equities.
The truth is rather more nuanced. One of the key findings of the Man Group study was that, alongside commodities, some of the most effective ways to hedge against inflation lie in particular equity style factors, namely trend-following and momentum strategies. So, equities do provide an effective hedge against inflation, so long as you select the right stocks at the right time. We believe that there’s a risk that in discarding property as a potential hedge for inflation en gros, we risk making the same mistake as those who post-1977 threw the babies of trend-following and momentum strategies out with the bathwater of equities. What we need is a more targeted approach to property investment, looking to deliver returns that are robust even in periods of inflation. This requires a granular and differentiated strategy that takes into account geography, type of tenure and economic backdrop. Not all property investment is the same and we believe that, if we are entering a period of higher inflation, investors in property will need to respond to this by being more discerning as to how and where they deploy capital.
There’s More Than One Inflation
There’s another subtlety to tease out – that not all inflationary conditions are the same, and that we have had only two brief periods of inflation in the UK – measured as price rises above 4% – since the early 1990s. So we have to be aware that – as we have seen with any number of economic and market-related factors in recent years – it’s not the error it once was in a world of unprecedented central bank intervention to say that this time it may be different. We are not sure whether the current inflationary pressures we are seeing in the US and, to a more limited extent, in Europe are transitory or entrenched and it is not clear what kind of inflation may hit when and if it does.
Figure 2. UK CPI
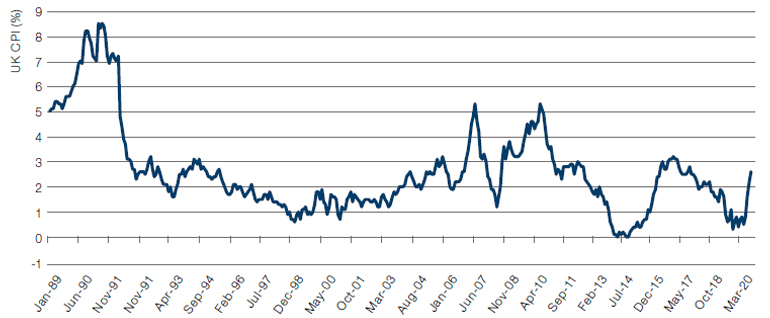
Source: Bloomberg; as of 1 July 2021.
If you look at UK property returns during inflationary periods, the majority of negative performance comes from periods of inflation in the first half of the 20th century. In two of the three most recent periods of inflation, residential property delivered double-digit returns. The US saw mild inflation in the 2007-2008 period due to the China demand boom, but this also coincided with the first rumblings of the Global Financial Crisis (‘GFC’). A 13% drop in US house prices and underperformance of housing in the early years of the Second World War contribute significantly to the negative returns to property during inflationary periods; removing these two periods leads property to have a positive return in periods of inflation.
In short, there appears to be very little consistency to the relationship between inflation and property prices – the range of returns to property in inflationary periods in the UK is 46%, while in the US it’s 28%. This may be because, as we said above, not all periods of inflation are the same. There’s a clear difference between periods of controlled inflation, which can be a sign of a healthy economy, and hyperinflation, when the economy overheats and we see significant erosion of real returns and interest rates spike in an effort to control rising prices. In periods of hyperinflation, returns to the majority of assets suffer, and property investors will see the real asset values of their investments decline, while income streams will be impacted by defaults as households are unable to meet mortgage and rental payments.
Not even the most ardent inflationistas are suggesting that we will experience hyperinflation any time soon. The majority of forces impacting prices globally remain disinflationary – most importantly the influence of technology, low interest rates and globalisation. We expect any inflation in the coming years to be manageable and, if anything, supportive of house prices in many areas.
There’s More Than One Housing Market
It’s always an error to treat housing markets as homogenous entities.
It’s always an error to treat housing markets as homogenous entities. Figures 3-4 show the performance of two areas of the UK in the years of the GFC and subsequently, illustrating clearly that volatility in these years was not distributed evenly across all regions. Numerous similar examples might be found in the US. Importantly, the period between December 2009 and September 2011 is one of the inflationary periods highlighted in the Man Group research in which UK property prices fell significantly. During this period, prices in London rose by 3.5%.
Figure 3. Average House Prices - London
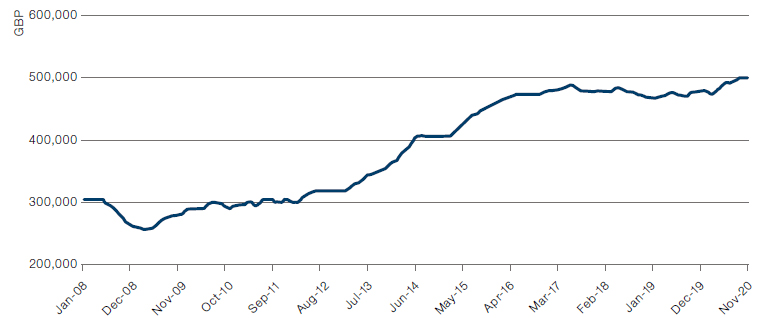
Source: Property Data; as of 12 December 2020.
Figure 4. Average House Prices – North-East England
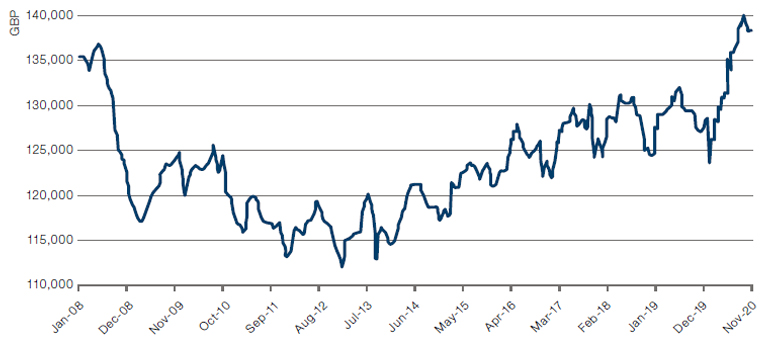
Source: Property Data; as of 12 December 2020.
The key takeaway for us is that it is more important than ever – at times when inflation appears to be raising its head – to be focused on deploying capital into situations where there is genuine alpha to be generated, and to be cognizant of the significant dispersion of returns between different tiers of the market, different geographies and different housing tenures.
Capital Versus Income in Inflationary Times
Most of the analysis carried out on property in periods of inflation looks only at capital values. While there are occasional studies that seek to assess the impact of inflation on a property portfolio’s total return (Dirk Brounen et al. carried out an exhaustive study of inflation and housing returns in Holland that used income as well as capital value, for instance), generally analysts use the Case-Shiller Index in the US and the Nationwide Index in the UK to show house price appreciation/depreciation. Not only does this not take into account the powerful regional variation in returns, but, crucially, it doesn’t recognise that many investors participate in the housing market as much for its income streams as for capital appreciation.
Looking back over the past decade, we can see that while house prices have moved sharply higher, notwithstanding the generally low-inflation backdrop, rental income has failed to keep up, growing at an average of 1.8% over the past 10 years in the private rental sector, around 2.5% in social rents (which were rising from a lower initial base and whose rent reviews are often explicitly linked to inflation). This is compared with a near-5% annual rise in average house prices nationally. In London, house prices during this period rose 67%, while average rentals fell almost 6%. What is clear is that there is a clear distinction between income yields and capital appreciation.
Figure 5. Index of Private Rental Prices Percentage Changes Over 12 Months
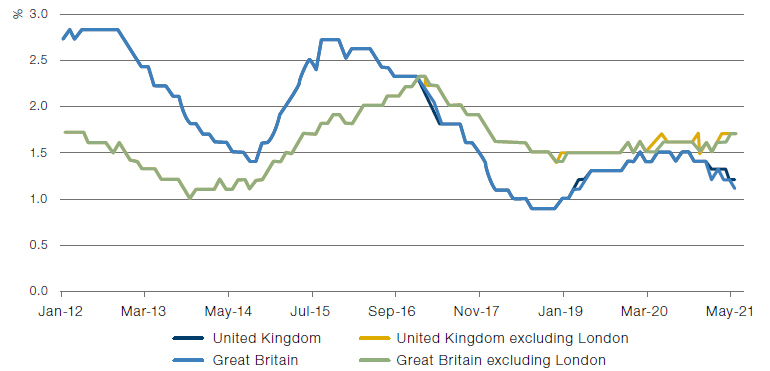
Source: JP Morgan; as of 1 June 2021.
While we are not here seeking to discount the importance of capital values when undertaking property investment, we believe that much of the academic research in the area misses the key aspect of income when looking at the impact of inflation. Those few studies that do use total return rather than merely capital appreciation tend to show significantly better performance for housing in periods of inflation.
The strong message is that you can’t invest in averages and that housing markets are deeply idiosyncratic in the way they respond to external stimuli.
Again, though, we come back to the need to deliver alpha through correctly selecting assets whose performance will be resilient through different economic conditions. This brings together many of the concepts that we’ve discussed above and in our broader white paper on Community Housing. To generate alpha, you need to look at a granular level at the specific dynamics of local housing markets. Figure 6 shows how widely dispersed returns are on a geographical level when looking at both rental income and house price appreciation. While there is clearly some correlation between the two measures, it’s far from a simple picture: markets like Guildford, Canterbury and Winchester are seeing significant house price growth while private rentals have grown at levels below inflation; on the other hand, rents in Newcastle, Derby and Burnley have significantly outstripped house prices. Once more, the strong message is that you can’t invest in averages and that housing markets are deeply idiosyncratic in the way they respond to external stimuli. The time period covered by the data below comprises a period of generally low inflation (averaging a shade over 2%) as well as a significant market correction (in 2008-10). Notwithstanding this, most house prices and rents grew at above-inflationary levels, although, again, there is huge geographic dispersion in these data.
Following on from this analysis, Figure 7 shows that even within the rental market, there exists a wide dispersion of growth rates between social and private markets. As stated above, social rental yields have been growing more swiftly than the private market in most areas, coming from a lower base and driven by a benign economic backdrop. This is largely because social rent levels are set by government rules and are often structured on a CPI+ basis, hence the outperformance relative to inflation. However, electing to invest in areas of the country where affordable housing rent inflation exceeds market rent inflation introduces a long-term viability challenge. We must be cognisant that any attempt by investors to drive through significant increases in rentals on the back of an increase in inflation may be seen by governmental watchdogs as rent-seeking behaviour. Therefore, to ensure long-term sustainability of returns, we target areas where rents have lagged the broader market, while recognising that, given the fact that rental yield growth has lagged house prices in the past decade, there remains head-room in rental yields in many locations.
Figure 6. Median Rent Versus HPI CAGR
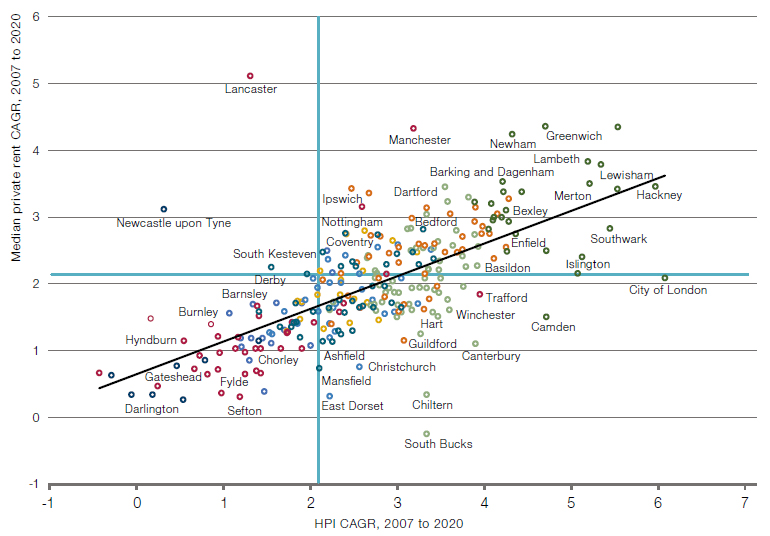
Source: Man Group; Between 2007 and 2020.
Figure 7. Median Rent Versus Affordable Social Rent CAGR
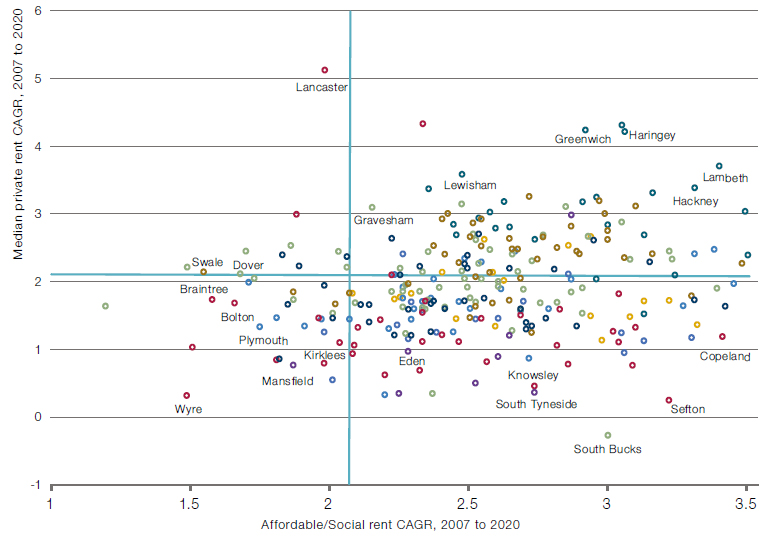
Source: Man Group; Between 2007 and 2020.
Property and Levelling Up
We conclude with a final thought about the way inflation might feed into the property market in the coming years. It may be that inflation, far from harming property, could further stimulate the market, and particularly the income element that we have discussed above. The one thing that recent (albeit mild) bouts of inflation haven’t brought with them is wage growth, at least not at the lower- and middle-income ends of the scale. With narratives of levelling up and fairer wages for all standing at the centre of political life on both sides of the Atlantic, we could see rising incomes feed into a newly buoyant property market as those who have been kept out of home ownership (or even renting) because of stretched price-to-income ratios are finally able to enter the market.
Conclusion
Those seeking to prove or disprove a relationship between house prices and inflation are probably asking the wrong question in the first place.
This is not an article that seeks to make a definitive statement on whether inflation will hit and how forceful that hit could be; there are others better-qualified than us to make such judgements. What we can say is that treating the UK housing market as a homogenous whole is a form of category error, obscuring more than it reveals. It seems to us clear that property’s relationship to inflation is difficult to wrap within a single broad statement, both because of its geographical idiosyncrasy and because the data through time is so seemingly contradictory. There are areas of the market that appear to us fully valued on a capital basis where there is still room for growth in rents and vice versa. We have experienced inflation in house prices in many areas, particularly London, over the past few decades despite there being a benign inflationary backdrop. We believe that well-built houses in good locations offering a range of tenures will outperform the broader market whatever happens to the CPI number.
In short, we believe that those seeking to prove or disprove a relationship between house prices and inflation are probably asking the wrong question in the first place. To create a viable inflation-linked investment opportunity, investors may consider shifting their focus to the detailed underwriting of investments with a separate analysis of both expected long-term rental and value appreciation.
Bibliography
Ahrens, A., K. Beirne, P. Economides, I. Kostarakos, K. McQuinn, and C. O’Toole (2020): A review of the methodologies used in compiling owner-occupiers’ housing indices, Papers WP651, Economic and Social Research Institute (ESRI).
Ambrose, B., N. E. Coulson, and J. Yoshida (2015): The Repeat Rent Index, The Review of Economics and Statistics, 97(5), 939950. (2018): Reassessing Taylor rules using improved housing rent data, Journal of Macroeconomics, 56(C), 243-257.
Bentley, A. (2018): Rentals for housing: A model-based estimator of inflation from administrative data, Discussion paper, New Zealand Statistics Authority.
Brounen, D., Eichholtz, P., Straetmans, S. and Theebe, M., Inflation Protection from Homeownership: Long-Run Evidence, 1814–2008, Real Estate Economics, Vol. 42, Issue 3, pp. 662-689, 2014.
Corrigan, E., D. Foley, K. McQuinn, C. O’Toole, and R. Slaymaker (2019): Exploring affordability in the Irish housing market, Economic and Social Review.
Diewert, W., A. Nakamura, and L. Nakamura (2009): The housing bubble and a new approach to accounting for housing in a CPI, Journal of Housing Economics, 18(3), 156171.
Dougherty, A., and R. Van Order (1982): Inflation, Housing Costs, and the Consumer Price Index,American Economic Review, 72(1), 154-64.
Fama, E. and Schwert, G. Asset Returns and Inflation, Journal of Financial Economics, 1977, vol. 5, issue 2, 115-146.
Hill, R., M. Steurer, and S. Waltl (2019): Owner-Occupied Housing, Inflation, and Monetary Policy, Graz Economics Papers 2019-05, University of Graz, Department of Economics.
Johnson, P. (2015): UK consumer price statistics: A review, Discussion paper, UK Statistics Authority.
Lewis, R., and A. Restieaux (2015): Improvements to the measurement of owner occupiers’ housing costs and private housing rental prices, Discussion paper, UK office for national statistics.
Shimizu, C., K. G. Nishimura, and T. Watanabe (2010): Residential rents and price rigidity: Micro structure and macro consequences, Journal of the Japanese and International Economies, 24(2), 282-299.
Verbrugge, R., and R. Poole (2010): Explaining the Renter Inflation Divergence, 1999- 2007, Real Estate Economics, 38(4), 633-657.
You are now leaving Man Group’s website
You are leaving Man Group’s website and entering a third-party website that is not controlled, maintained, or monitored by Man Group. Man Group is not responsible for the content or availability of the third-party website. By leaving Man Group’s website, you will be subject to the third-party website’s terms, policies and/or notices, including those related to privacy and security, as applicable.