Key takeaways:
- Systematic risk modelling is a useful tool for predicting returns during presidential election years. Our MacroScope model finds that both industry and style factors typically see larger price moves when compared with nonelection years, particularly amongst industries susceptible to policy and regulatory shifts
- Over the long term, both industry and style factors outperform in anticipation of a Republican presidency and underperform during one. A Republican lead in the polls may offer a boost for Earnings Yield and Size and most industry factors, while expectations of a Democrat victory is associated with Momentum, Growth and Tech outperformance
- In today’s electoral environment, our model favours Momentum and Beta, and Biotechnology and Software Services
All eyes are on the US presidential contest, after a spate of unexpected electoral outcomes around the world this year. Conducted as the world’s largest economy faces inflationary pressures and recessionary threats, the race will likely exert substantial influence on financial markets. The incoming administration will shape fiscal policy and thereby affect investor confidence – and the nominees have taken markedly different directions so far.
This article evaluates the historical effects of US presidential elections on stock return variability. We predict that the implications would be more pronounced during election periods, given the additional volatility that political uncertainty introduces into the macroeconomic context.
To test this thesis, we used a dataset covering the US presidential elections between 1996 and 2020. Using our MacroScope model to compare economic and market data from different economic regimes and previous election cycles, we segmented the cycle into the months preceding the election, the election month itself, and the subsequent presidential term to distinguish market reactions and fully capture the electoral implications.
Next, we examined whether stocks are affected by elections, and – if so – which ones; how polling affects factor performance; and how electoral outcomes shape quant returns over the short and longer term, including if market tropes such as the ‘Presidential Puzzle’ could be explained or undermined by our analysis. Finally, we ask how investors should position themselves going into this election.
Do elections really matter?
We started with two questions: first, do markets anticipate election impacts prior to the event? And second, does asset performance differ in election years compared to nonelection years?
Our MacroScope model
The MacroScope is a systematic regime-modelling framework that examines recurring macroeconomic patterns. Unlike discrete methods, the MacroScope views macro regimes as continuous concepts, assessing period-to-period similarities continuously rather than categorising them rigidly. This framework helps identify granular patterns in macroeconomic environments during past elections.
Different economic environments can amplify the effects of electoral outcomes on stock prices. During periods of economic expansion, for instance, the impact of an election might be moderated by robust economic growth, which can offset uncertainties related to policy changes. Conversely, in times of economic contraction or recession, elections may exacerbate market volatility, as investors become more sensitive to potential shifts in fiscal and monetary policies.
With this observation in mind, we found that, while fundamental analysis of companies is critical to predicting future performance, our MacroScope model was able to determine broader style- and industry-specific trends in stock performance.
For clean factor payoffs, we applied industry and style factors estimated via the Barra model. Figure 1a illustrates the annualised returns and volatilities of Barra style factors in the months leading up to the election (January through October) during election years, juxtaposed with the same period in non-election years. Generally, style factor payoffs were superior in non-election years, except for Momentum and Profitability. Risk-oriented factors such as Residual Volatility and Earnings Variability underperformed prior to elections, likely reflecting increased investor risk aversion amid elevated market volatility due to electoral uncertainties. Additionally, factor return volatilities were typically higher in the pre-election months compared to non-election years.
Figure 1b presents a similar analysis for Barra industries. The most significant return differentials between election and non-election years are observed in industries susceptible to policy and regulatory shifts. Compared to non-election years, industries like Semiconductors, Semiconductor Equipment, and Internet Software & Services tend to underperform before elections, while Biotechnology, Pharmaceuticals, Mining, and Energy industries often outperform. This underscores the notion that potential policy changes are closely monitored by investors and incorporated into asset prices leading up to elections.
Figure 1a. Style Factor Performance in Months Prior to Presidential Elections
1 January 1994 – 31 October 2023
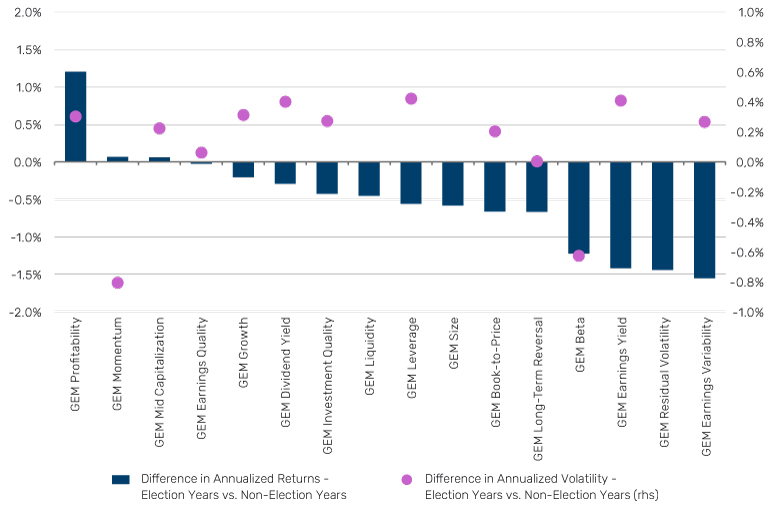
Source: MSCI, Man Numeric.
Figure 1b. Industry Performance in Months Prior to Presidential Elections
1 January 1994 – 31 October 2023
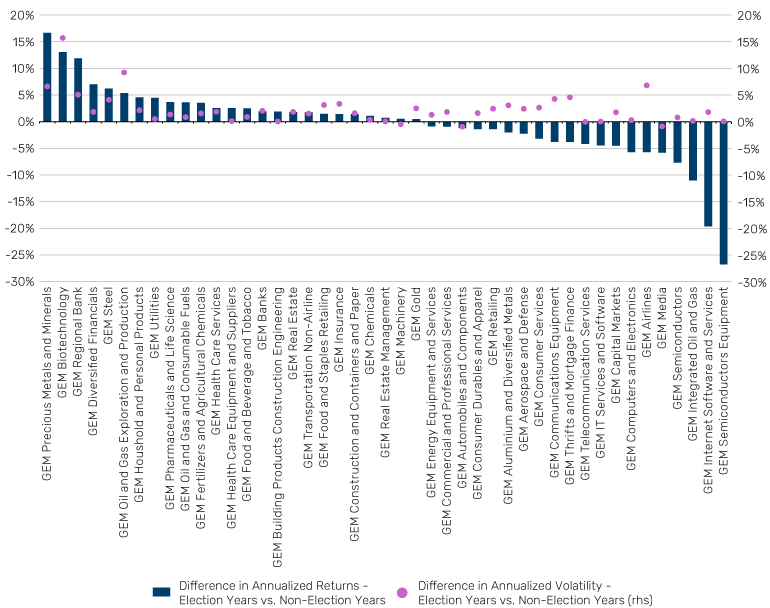
Source: MSCI, Man Numeric.
Payoffs from polling
Having established that asset performance varies between election and non-election years, we tested how electoral uncertainty influences market dynamics before an election. Here, we used historical polling data from FiveThirtyEight, which aggregates up to 1,106 national polls, weighted by sample size, recency, historical accuracy, and polling firm methodology. From this dataset, we analysed US presidential elections from 1996 to 2020, examining the spread between the polling averages of the presumptive Democratic and Republican candidates.
In particular, we explored the relationship between Barra factor returns and the polling differential between Democrats and Republicans. The metric assesses how different industry and style factors are affected by the potential victory of either party. We categorised any lead smaller than 2% as being inconclusive and examine this case separately. In Figure 2a, we observe that a Republican lead is typically correlated with outperformance for Earnings Yield and Size. The lower tax and looser regulations that Republican Presidents typically promise spur increased optimism for large corporates. Similarly, outperformance by the Momentum and the Growth factors suggests that the prospect of a Democratic win is conducive to Biotechnology and Industrial Metals. Regardless of the polling scenarios, risk-oriented factors such as Beta and Residual Volatilities typically perform the worst as election uncertainty dampens market sentiment.
Industry returns in Figure 2b reveal a similar picture. We observed that energy industries are the most sensitive to changes in polling statistics. For instance, there is a large return differential for Integrated Oil & Gas and Oil & Gas Exploration between Democrat and Republican leads. In addition, the struggling performance of industries such as Semiconductors when there was no conclusive lead indicates that industries with high exposures to China or those involved in semiconductors will be particularly vulnerable to the uncertainty of foreign-policy hawkishness. We can expect the stark partisan divide in foreign policy preferences to play a role in driving performance for those industries that may be particularly affected by issues such as tariffs.
Figure 2a. Annualised Style Factor Performance During Election Years by Polling Statistics
1 January 1996 – 31 October 2020
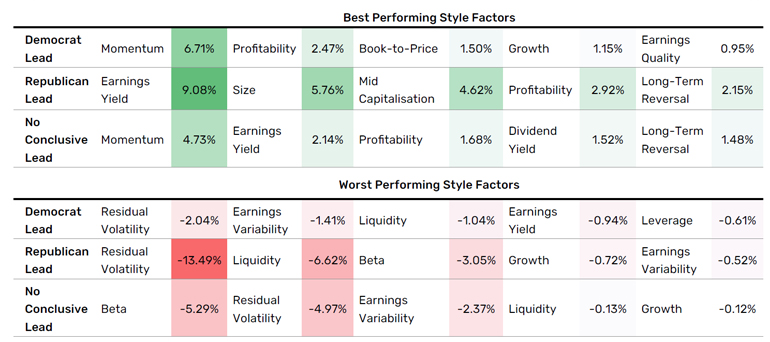
Source: MSCI, Man Numeric.
Figure 2b. Annualised industry performance during election years by polling statistics
1 January 1996 – 31 October 2020
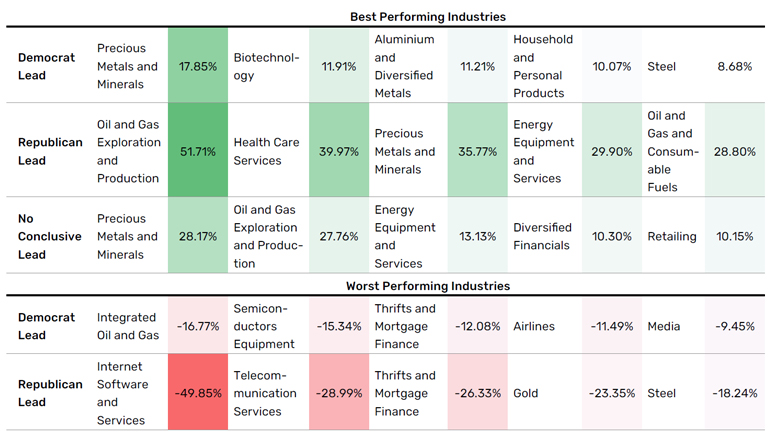
Source: MSCI, Man Numeric.
Oil barons versus tech titans
Having understood the impact of polling, a logical follow-up question is how markets typically respond to election outcomes afterwards. For this, we divided the assessment into short-term reactions immediately following the election and the longer-term market impact, acknowledging that it takes time for the market to fully digest the election outcomes. Given that US presidential elections typically occur early in November, factor performance over the month reflects the initial market response to the election outcome. Regardless of the long-term impact of the White House on factor returns and company fundamentals (described in the next section), the initial market reaction reveals interesting and potentially useful patterns.
We found that presidential election years often show larger price movements, for both style and industry factors, over November (Figure 3). This confirms the idea that markets, in the short term, are significantly impacted by the outcome of presidential elections, reflected in the magnitude of factor returns. The directional impact is mixed, with style factors such as Earnings Yield and Book-to-Price outperforming, while factors such as Beta, Growth, and Momentum show declines.
The directional impact of industry factors reveals a much clearer picture; Republican wins are associated with outperformance in most industries, most notably Steel, Oil & Gas, and Banks. The market shows a strong initial reaction, given the consistent policies of the Republican party that favours these industries. However, we do observe tech-related industry factors, such as Semiconductors, Communications Equipment, and Internet Software outperforming during years when Democrats win. Given the partisanship in foreign policy regarding Taiwan, we can expect to see performance for industries linked to Semiconductors to be highly dependent on the election outcome.
Figure 3a. Style factor performance for November
1 November 1995 – 30 November 2023
Source: MSCI, Man Numeric.
Figure 3b. Industry performance for November
1 November 1995 – 30 November 2023
Source: MSCI, Man Numeric.
Figure 4. Similarity scores with previous election years
1 January 1996 – 19 September 2024
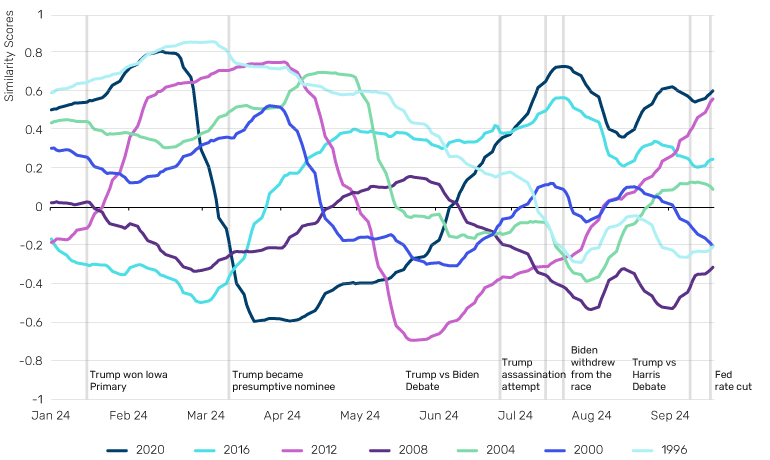
Source: Man Numeric.
As a case study, we honed in on 2012 and 2020, two elections our MacroScope has identified as similar to today’s electoral environment, to ask how the macroeconomic backdrop and election outcomes have jointly affected stock returns immediately following these two elections. Figure 6a explores this by comparing the factor landscape in November 2012 and November 2020. From a style factor perspective, November 2020 witnessed a significant outperformance from Beta compared to 2012, while Momentum experienced a substantial drawdown. Although the resolution of election uncertainty improved market sentiment, the rally in Beta and the Momentum reversal were largely attributed to positive news about Covid-19 vaccines, which shifted investor sentiment and expectations for economic recovery.
Conversely, industry return variations were more strongly influenced by the election in both years. Due to policy divergences between the two political parties and differing election outcomes in 2012 and 2020, politically and regulatory-sensitive industries exhibited vastly different performances post-election. Semiconductor Equipment rose over 11% in November 2020, in contrast to a modest positive in November 2012. The Democratic victory in 2020 spurred hopes for improved trade relations with China, benefiting the industry given its global supply chain. Gold suffered drawdowns during both election cycles, as the reduced uncertainty after the election prompted risk-on flows from gold to other sectors.
FFigure 6a. Style Factor Returns in Election Months
November 2016, November 2020
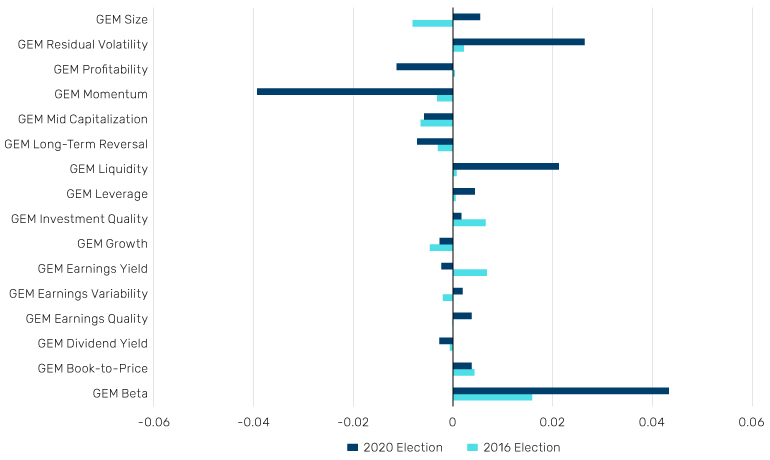
Source: MSCI, Man Numeric
Figure 6b. Industry returns in election months
November 2016, November 2020
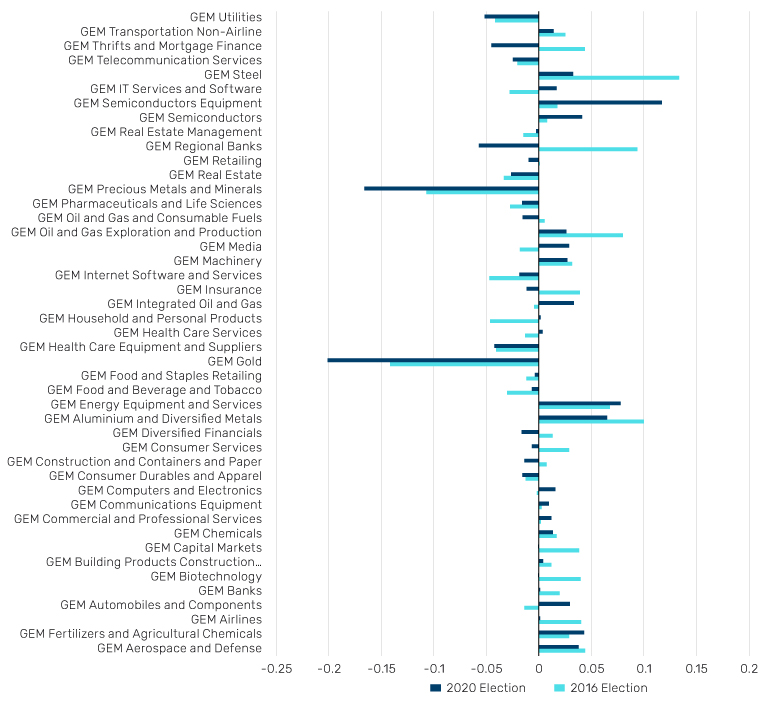
Source: MSCI, Man Numeric.
The performance-volatility tradeoff
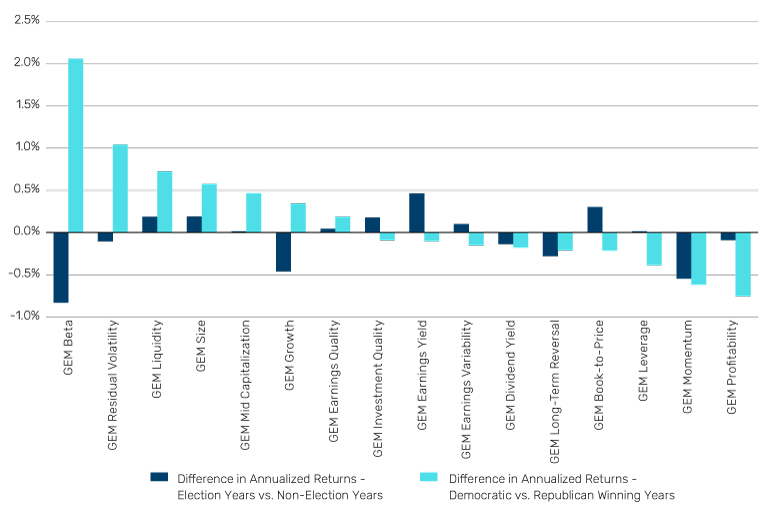
Zooming out again, what are the long-range impacts of elections on factors, such as over the entire presidential term (Figure 7)? Academic literature documents a phenomenon known as the ‘Presidential Puzzle’, that although markets typically outperform in anticipation of and in reaction to Republican victories (as shown in our analysis above), they underperform during Republican presidencies. Our analysis of style factors supports this theory, with most factors including Beta performing better during a Democratic presidency. While many explanations related to congressional policy and behavioural economics have been published, it largely remains a puzzle. We observe higher realised volatility during Democratic presidencies, which suggests an implicit cost to this outperformance.
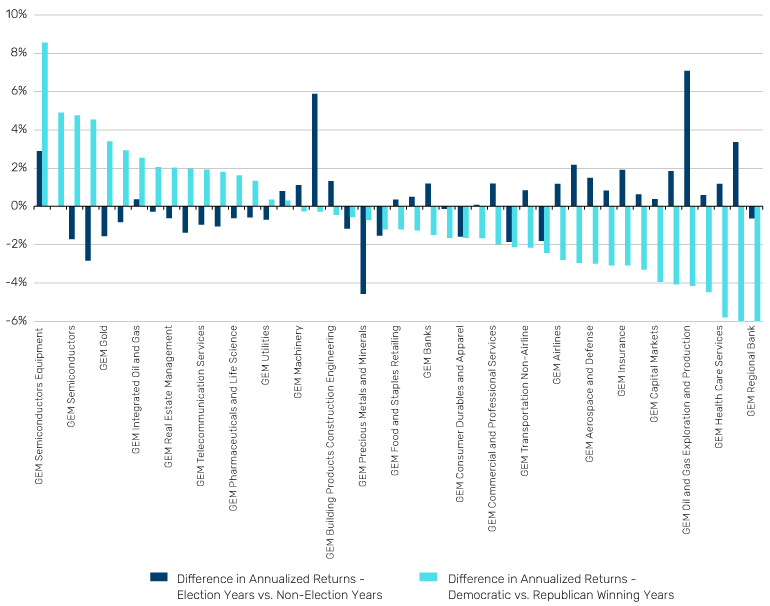
Examining industry factor performance by election outcome also undermines the idea that Republican presidencies lead to equity outperformance relative to Democratic presidencies. Indeed, several sectors that one would expect to outperform during Republican presidencies instead show more muted performance; Aerospace and Oil & Gas are notable examples.
These observations can also be understood in the context of the idea that company fundamentals are not as affected by election outcomes as market reactions to polls might suggest. Other factors beyond the control of the White House may play a large impact, reducing the ability of government policies to significantly impact factor returns in the long term. Forecasting the financial impact of election outcomes is a very different task for short-term and long-term investors.
Figure 7a. Style factor performance over presidential terms
1 January 1994 – 31 July 2024
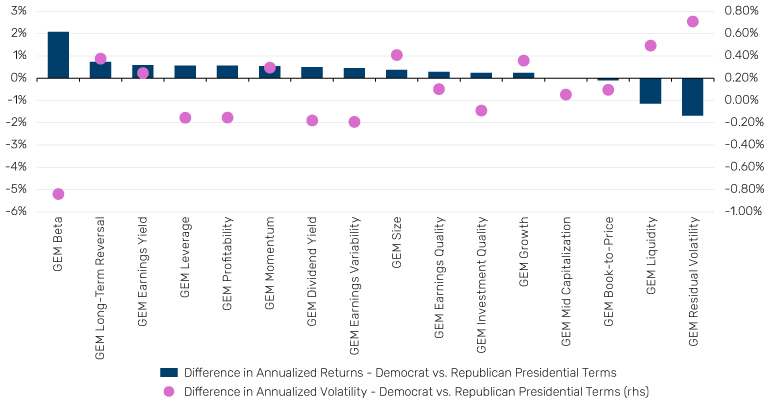
Source: MSCI, Man Numeric.
Figure 7b. Industry performance over presidential terms
1 January 1994 – 31 July 2024
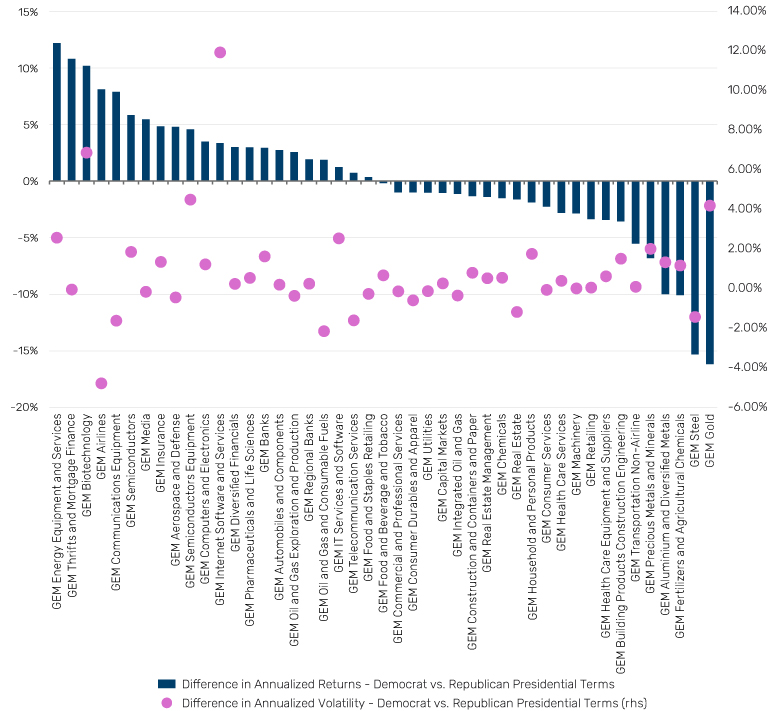
Source: MSCI, Man Numeric.
Today’s outlook: Gathering momentum
So – how should systematic investors position themselves today? Drawing insights from similar or opposing macro regimes, the MacroScope model currently favours Momentum from a style factor perspective. While Momentum historically underperforms in November following presidential elections, it tends to generate positive returns over the presidential term. Additionally, the model takes positive bets on Beta, aligning with observations from the 2016 and 2020 elections when the market rebounded post-election.
Regarding industry positioning, the model favours Biotechnology and Internet Software & Services. Conversely, it bets against Gold, Thrifts and Mortgage Finances. Interestingly, both industries have been sensitive to election outcomes during the last two presidential elections, exhibiting vastly different performances in November following these elections.
Figure 8a. MacroScope Positioning – Style Factors
19 September 2024
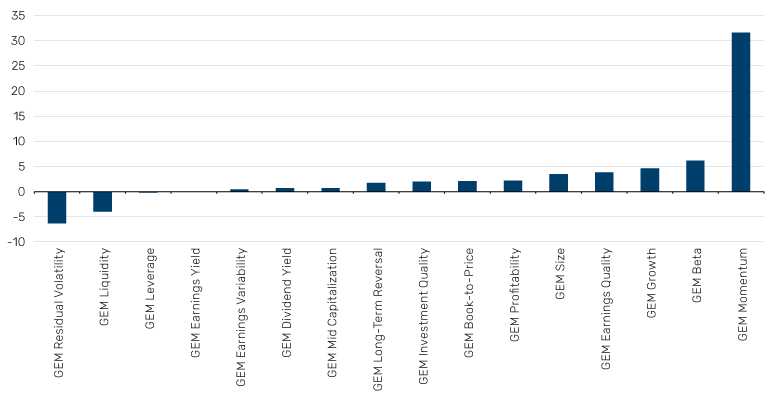
Source: MSCI, Man Numeric.
Figure 8b. MacroScope Positioning – Industries
19 September 2024
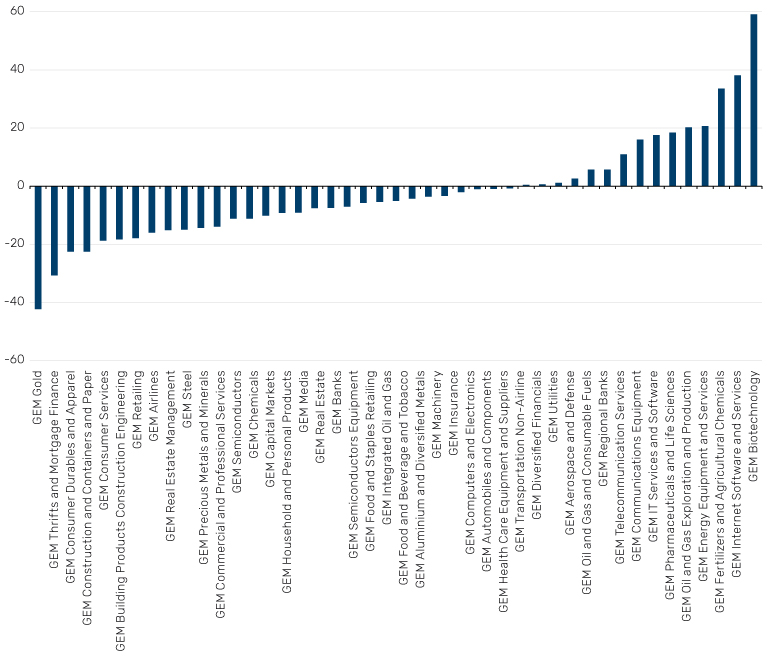
Source: MSCI, Man Numeric.
Conclusion: Strategic asset allocation in systematic investing
While company fundamentals are pivotal determinants of future stock performance, systematic risk; including industry and style factors; has assumed a more important role.
Our analysis reveals that election years, particularly those with clear political leadership transitions, exhibit distinct patterns in market volatility and returns. Sectors such as Energy, Healthcare, and Technology demonstrate varied responsiveness to election outcomes, underscoring the importance of strategic allocation during these periods.
While the Presidential Puzzle remains unsolved, it’s clear that the relationship between optimism in the markets surrounding a Republican victory and unrealised gains once the party is elected, still holds. Projections of a Republican win may offer a boost for certain style and many industry factors, but expectations of a Democrat victory herald an optimistic outlook for many of the factors which have outperformed over recent years.
While historical trends provide valuable insights, the unpredictability of political landscapes necessitates a nuanced approach to investment strategies. Investors are urged to consider both macroeconomic backdrops and sector-specific dynamics when navigating electionrelated market fluctuations.
The intersection of elections and markets remains a complex domain requiring ongoing research and adaptive strategies. As we look toward future election cycles, a comprehensive understanding of these dynamics will be essential for informed decisionmaking and optimised investment outcomes.
You are now leaving Man Group’s website
You are leaving Man Group’s website and entering a third-party website that is not controlled, maintained, or monitored by Man Group. Man Group is not responsible for the content or availability of the third-party website. By leaving Man Group’s website, you will be subject to the third-party website’s terms, policies and/or notices, including those related to privacy and security, as applicable.