Continuing rate hikes have made it abundantly clear that central banks mean what they say when it comes to controlling inflation.
We commented in our past quarterly on the potential value that was appearing in credit markets, but even we were surprised by the ferociousness of the rally in the first few months of the quarter. Convertibles and HY led the way, delivering over 6.4% and 7.4% respectively by mid-August. It is therefore peculiar that we sit here again seeing value in credit, as the first half rally in Q3 quickly eroded and valuations once again appear cheap.
It is amazing how quickly narratives can change. The principal factor behind the summer rally was an expectation of a dovish pivot from the Fed. This concept was put to bed at Jackson Hole and at subsequent meetings of not only the Fed, but the ECB and other central banks who showed resolve to fight higher inflation.
Continuing rate hikes have made it abundantly clear that central banks mean what they say when it comes to controlling inflation. Given the pace of hikes priced into markets (Figure 1) recession remain our base case scenario. This backdrop has clearly been painful for fixed income and credit investors, but we are starting to become more optimistic. With all-in yields at near 10-year highs we think the potential returns from credit could warrant a second look from asset allocators. In terms of favoured markets, one would have to start in investment grade with all-in yields broaching 5%. European HY is another example, with iTraxx Crossover pricing in a cumulative default rate of over 44% over the next five years, which would far outstrip any previous default cycle (Figure 2). Convertible bonds continue to trade cheaply with a significant amount of the universe in busted territory and with issuance expected to increase we believe that opportunities will no doubt increase. Finally, we have remained bearish on EMD for some time, but the storm clouds may be parting with some parts of the market providing attractive selection opportunities such as EM HY.
Figure 1. 5-Year Swap Rates
Problems loading this infographic? - Please click here
Source: Bloomberg; as of 30 September 2022.
Figure 2. Markit iTraxx Europe Crossover Index
Problems loading this infographic? - Please click here
Source: Bloomberg; as of 30 September 2022.
With risk elevated, survivability remains critical when it comes to positioning. For credit investors, the solution is to identify those firms with resilient cashflows, strong liquidity and positive industry dynamics. This should allow them to weather a recession. With volatility and dispersion picking up we believe this provides a strong backdrop for active managers.
Investment Grade
The impact of higher interest rates has been painful for IG investors in the short term. However, the long term impact has meant that all-in yields in the IG market stand at around 5.3% yield-to-worst (‘YTW’), which are the highest levels since mid-2009. We have rarely been in an environment where spreads, valuations and interest rate risks look like an attractive option for asset owners.
From a valuation perspective we continue to see signs of inflation slowing and likely peaking in H1 2023 due to falling energy prices, freight rates and agricultural commodities coupled with base effects. A backdrop of falling inflation and slowing growth could see central banks take the foot off the tightening pedal given the significant amount of hikes already priced into the market.
Sectorally, we continue to remain defensively oriented from an overall spread duration perspective and maintain our positive outlook on real estate, alternative financials, and energy. Given the recent sell-off in the UK, we are exploring deep value opportunities in a variety of UK firms that offer yields north of 9%.
High Yield
With global HY spreads currently at 613 bps, similar conditions have historically provided an attractive allocation point. Forward 1-year returns are positive, with the average returns resembling equity returns, in the high single digits/low double digits1.
Valuations in portions of the high yield markets are starting to look cheap.
As highlighted above we believe that valuations in portions of the high yield markets are starting to look cheap, with a strong preference for opportunities in the non-cyclical portions of the market. Investors do not have to sacrifice yield or credit quality for this trade, as we continue to see ample opportunities in this space. On a regional basis we continue to prefer Pan-European credit over the US given the higher risk premiums on offer. Additionally, we find a number of discounted credits in the UK focused on consumer staples. Finally, we are seeing more attractive opportunities in banks for the first time in over a year, with all-in yields looking more attractive within an industry that remains well capitalised and that should benefit from higher interest rates through improved net interest margins.
Figure 3. Sector Dispersion - % Increase in Global HY Spreads YTD
Problems loading this infographic? - Please click here
Source: Bloomberg; as of 30 September 2022. Segments in yellow signify non-cyclical sectors.
Emerging Market Debt
We are likely experiencing the final stages of this year’s EM selloff.
As we mentioned in our previous outlook, we are likely experiencing the final stages of this year’s EM selloff, as financial markets reprice a ‘higher-for-longer’ monetary policy in DM. Beyond the drainage of global liquidity and consequent higher financial costs, EMD also faces other headwinds from the adverse effects of the escalations of the war in Ukraine to economic underperformance in China.
In hard currency, EM IG sovereign spreads have started to widen, but we are of the view that additional widening is likely when viewed in the context of historical standards, particularly given the current global backdrop and heightened volatility. In EM HY, spread widening for select issuers is warranted by increased default risks, so country and issuer selection will be key.
For EM local currency, the global tightening financial conditions, deteriorating terms of trade and EM portfolio outflows are a hostile environment for local rates and currency performance, particularly in countries with higher external financing needs and lower real interest rates. However, with FX valuation dispersion at historical highs, valuations in some parts of FX are reaching more distressed levels, suggesting differentiation is paramount. Currencies where central banks have hiked aggressively, external imbalances are smaller, and valuations have adjusted significantly, are likely to perform better, in our view. However, for currencies with weaker current account balances and macro imbalances (for example some commodity exporters – including MXN, BRL, COP, CLP and ZAR) a more significant repricing could still lie ahead.
Convertible Bonds
On a risk-adjusted basis convertible bonds have started to show better risk-adjusted returns than traditional asset classes in H2 versus the previous 12 months2. As bond floors have stabilised somewhat, convertibles are well placed to start outperforming after the recent cheapening, as they offer a high degree of convexity in the current uncertain environment.
After the relative underperformance of the last few months, mainly due to an oversupply of expensive new bonds issued in 2020 and 2021 by companies with high-multiple equity stories, the convertible market allows investors to:
- Buy ‘Growth’ equity stories at very attractive valuations. The average correction of the top 20 tech and/or Growth stocks underlying CBs is more than twice the average correction of the S&P 500 Index;
- Gain exposure to oversold equity markets via convex convertible bond profiles, with the premium to bond floor at the lowest level since 2016;
- Have lower fixed income duration versus IG and HY bonds.
Unlike during much of the recent past, the majority of convertibles now trade with a positive yield-to-worst. On top of this, following the bumper levels of issuance in 2020 and 2021, companies are generally well placed from a liquidity standpoint and there is no upcoming maturity wall to be concerned about. For those companies who might face some difficulties, convertible investors may be reassured to know that more than 60% of CB issuers have only convertible debt on their balance sheet, putting investors in control of those capital structures. The figure is even higher for firms that issued in 2021 and managed to price deals on historically aggressive terms3.
Convertible investors are also well placed, as a reminder, to benefit from rising M&A activity due to the embedded ratchet mechanism that boosts conversion terms for holders. M&A activity in the CB space has been elevated so far this year and subject to market conditions we expect this trend to continue as firms look to deploy available capital to boost growth.
Convertible Bond Arbitrage
The higher volatility goes, the more prices diverge from theoretical value, as markets struggle to trade quickly enough to keep up.
With both an equity and bond component, convertible bonds are some of the slowest instruments to reprice in the market. The higher volatility goes, the more prices diverge from theoretical value, as markets struggle to trade quickly enough to keep up. As we have previously written, rising levels of volatility in 2022 have caused a plethora of dislocations. Quite simply, opportunities have not been this high for at least a decade. Valuations once again look attractive with a number of high quality, cash flow positive names continuing to trade in busted territory.
However, while it produces opportunity, volatility nevertheless presents risk. We would argue that a tactical approach is required, both in terms of managing gross exposure alongside credit and rates hedges to help to minimise various fixed income factor risks. Nevertheless, for managers who can maintain hedging discipline, the outlook remains more positive than it has in many years.
Distressed Debt
The distressed debt environment is the most interesting we have seen for many years.
Market dynamics are such that the distressed debt environment is the most interesting we have seen for many years. Indeed, it is arguable that we are on the cusp of a career-defining default cycle: the global debt burden is the highest it has ever been, and is exceptionally vulnerable to the dislocations caused by inflation and rising rates.
Despite the current cycle being large enough to rival the Global Financial Crisis, we are not expecting to see similar dynamics of default. Distress is currently being driven by the hiking cycle enacted by the Fed, rather than the collapse of a developed market asset bubble. It is therefore emerging rather than developed markets which are feeling the pain: EM sovereigns are beginning to default, and EM corporate debt is selling off as a result. In contrast, DM credit is showing far fewer signs of distress. This is to be expected – the Fed is hiking based on US rather than global data, and with regard for the stability of its own markets.
As such, we remain convinced that distressed investors will have to be geographically flexible if they wish to make the most of the rapidly expanding opportunity set. Unlike in 2008, the US is unlikely to provide a large number of defaults. Instead, investors should look to Europe, where energy prices are causing credit volatility, and to EM, where both sovereigns and corporates are struggling to serve dollar-denominated obligations. While the cycle might be larger than the GFC, we mustn’t assume that it will be the same – and must broaden our horizons as a consequence.
Credit Radar
Figure 4. IG Credit Spreads Versus History – EUR and GBP Valuations Pricing Recessionary Conditions
Problems loading this infographic? - Please click here
Source: Bloomberg and ICE BofAML; as of with analysis covering period between 31 March 2012 and 30 September 2022.
Figure 5. Credit Spreads - Global HY Valuations Looking Cheaper Relative to History
Problems loading this infographic? - Please click here
Source: Bloomberg and ICE BofAML; as of with analysis covering period between 31 March 2012 and 30 September 2022.
Figure 6. Convertible Bonds – Moving Back Into Cheap Territory
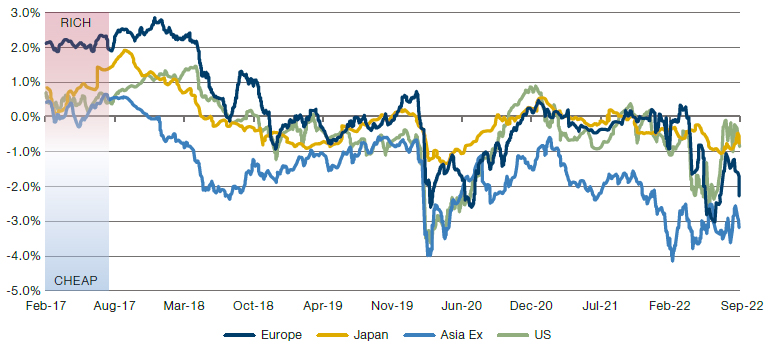
Source: Jefferies International Research as of October 2022.
1. Source: Man Group, Bloomberg ICE BofAML.
2. Source: BofAML.
3. Source: Man GLG, Bloomberg, BofAML.
You are now leaving Man Group’s website
You are leaving Man Group’s website and entering a third-party website that is not controlled, maintained, or monitored by Man Group. Man Group is not responsible for the content or availability of the third-party website. By leaving Man Group’s website, you will be subject to the third-party website’s terms, policies and/or notices, including those related to privacy and security, as applicable.