Introduction
The 2008 Global Financial Crisis (GFC) is the touchstone for investors in our lifetime. Selloffs, crises, even the consequences of financial contagion: all are measured by comparison to what happened in 2008. This makes us no different to previous generations. If we were to quiz the ghost of Benjamin Graham, we imagine that his point of reference would be the largest financial crisis of his career, the Great Crash of 1929.
For distressed debt investors especially, 2008 remains the benchmark. It was the largest distress cycle and offered some of the most rewarding distressed investing opportunities1 in modern history. As distressed debt levels once again approach those of the GFC, we could now be on the precipice of an even bigger, though surely different, distressed cycle. Fuelled by the latter stages of a forty-year bond bull market and turbocharged by Covid-induced borrowing, the global debt burden as a percent of GDP is now larger than ever before2 and appears vulnerable to a shift in the interest rate regime, at the same time it faces other, idiosyncratic stressors. The result has been a significant spike in distressed debt, led by emerging markets (EM) and EM sovereigns in particular (Figure 1). EM distressed has grown relative to developed markets (DM) distressed consistently and now represents 80% of the stock of distressed debt, from closer to 10% following the GFC, and the trend has accelerated since 2019 (Figure 2).
In our view, we may be on the cusp of a distressed debt super cycle – but unlike in 2008, the crisis is likely to originate from EM, not DM.
With more and larger EM sovereigns starting to default or restructure, distress in EM sovereigns has continued to expand. We now also view the contagion is beginning to envelop otherwise creditworthy EM corporates, and could spread beyond EM to infect DM, with European credit being particularly vulnerable. In our view, we may be on the cusp of a distressed debt super cycle – but unlike in 2008, the crisis is likely to originate from EM, not DM. Investors should be prepared: for those with flexible capital, a discerning research agenda and broad geographic scope, this could be the career-defining cycle.
Figure 1. Size of the distressed universe over time
Problems loading this infographic? - Please click here
Figure 2. Composition of the distressed universe over time
Problems loading this infographic? - Please click here
Source: ICE BofA Global High Yield Corporate & Sovereign Index, as of 30 July 2022. Includes below investment grade USD/EUR/ GBP/CAD bonds and excludes defaulted securities; a minimum amount outstanding of USD 250mm, EUR 250mm, GBP 100mm or CAD 100mm. Distressed universe defined as subset with an option-adjusted spread greater than 1,000bps. As of the 4 August, defaulted Russian sovereign bonds add a further $41bn, Ukrainian sovereign bonds add another $20bn and defaulted China RE bonds $27bn.
How Did We End Up Here?
The first thing to note is that the current situation in distressed debt did not arrive ex nihilo. As it stands, the market is very much the creation of policy decisions taken in the wake of the GFC.
Figure 3. Policy Rates in Major Developed Markets
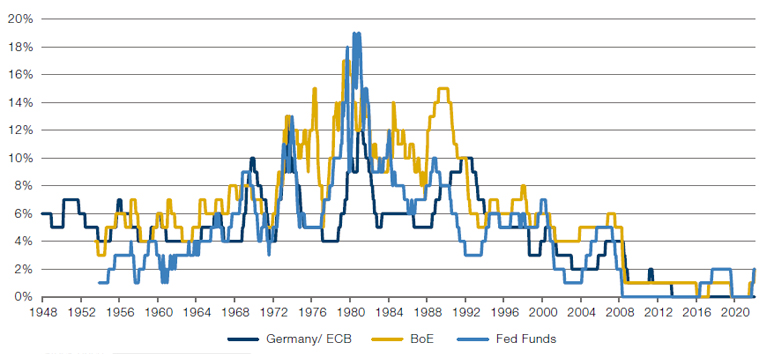
Source: Bundesbank, Bank of England, St Louis Fed, as of 18 August 2022.
The unprecedentedly low interest rates set by central banks in the aftermath of the crisis created the conditions for a rapid expansion in debt: because borrowing was historically cheap, it was no surprise that borrowers leveraged themselves to the eyeballs.
The unprecedentedly low interest rates set by central banks in the aftermath of the crisis created the conditions for a rapid expansion in debt: because borrowing was historically cheap, it was no surprise that borrowers leveraged themselves to the eyeballs, especially in EM (Figures 4 and 6). In the US, the HY bond market doubled between 2009 and 2022 to reach USD1.7 trillion.3 The market outside the US grew at a significantly faster rate to USD2.6 trillion during that same period: European high yield bonds and leveraged loans more than tripled in size to USD0.8 trillion and, in EM HY Eurobonds from corporate and sovereign issuers topped the size of US HY at USD1.8 trillion, more than quadrupling their size in 2009. This expansion in issuance was gratefully hoovered up by investment funds who were desperately searching for returns against the backdrop of index benchmarks offering ever-diminishing yields and spreads.
Figure 4. External EM HY bond stock (USD bn)
Problems loading this infographic? - Please click here
Source: JP Morgan research; face values as of 30 June 2022.
Figure 5. European loans and HY bond stock (USD bn)
Problems loading this infographic? - Please click here
Source: S&P LCD European All Loans Index and ICE BofA ML Euro High Yield Index; face values as of 30 June 2022.
Governments unleashed a tidal wave of global fiscal and monetary stimulus that increased debt burdens and widened deficits.
The Covid-19 pandemic accelerated these trends. Faced with a gargantuan dislocation across all markets in early 2020, governments unleashed a tidal wave of global fiscal and monetary stimulus that increased debt burdens and widened deficits not just for G7 countries plus China, but also significantly for EM sovereigns ex-China (Figure 6). The increase in spending was effectively a risk transfer from individuals and corporations to sovereigns, with governments standing guarantor for both groups via pandemic-induced subsidies. In the dislocation in early 2020, a handful of EM sovereigns that were vulnerable pre-pandemic, most notably Argentina, Ecuador, and Lebanon, were pushed to default. Coming out of the dislocation, however, there emerged no great increase in levels of distressed debt in DM, although smaller EM sovereigns such as Belize, Sri Lanka and El Salvador traded to distressed levels. As 2020 rolled into 2021, some EM corporate debt sold off, a large chunk of which involved the Chinese property market due to sector-specific policy action, but overall, government intervention postponed the distressed cycle we would have expected given the level of economic disruption. Pockets of opportunity in attractive EM corporates tended to offer idiosyncratic distressed opportunities, and were often tied to localised, regional or cyclical industry downdrafts. At the same time, interest rates returned to their lows, fuelling further investment into the high yield space – in part driven by a fear of missing out.
Figure 6. EM Government Debt as Percentage of GDP Versus Real GDP Growth
Problems loading this infographic? - Please click here
Source: JP Morgan as of 10 June 2022.
Where We Are Now
The ride out of the pandemic has been a bumpy one. More than a year of rising inflation has been accompanied by a series of geopolitical and economic shocks: severely strained supply chains, the collapse of leveraged Chinese property developers, and the Russian invasion of Ukraine.
This combination, especially the rising interest rates that have shadowed inflation, have wrong-footed fixed income markets. US Treasuries suffered their worst start to the year since 17884, while the high-yield market experienced its worst H1 since indices began in the late 1990s.5 Higher rates have made for a challenging secondary debt market, with new issuance now significantly more expensive and in some cases impossible for weaker companies and sovereigns. So-called ‘hung’ financings have also caused underwriters to become wary of getting caught out holding mispriced risk.6 Furthermore, a stronger US dollar and recession concerns have compounded refinancing risk due to higher spreads.
A stronger US dollar and recession concerns have compounded refinancing risk due to higher spreads.
Against this backdrop, there has been a recent surge in distressed debt, led by EM hard currency denominated debt, with EM sovereign debt at the vanguard. Since the end of 2019, hard currency EM Sovereign debt trading at distressed prices has more than tripled, while distressed EM Corporate debt expanded by 2.5x. Growth in DM distressed debt has been more muted – up 28% in the US and 19% ex US (Figure 1 and Figure 2). From a regional perspective, Latin America has the largest amount of distressed debt (notably 60% higher than North America), with Argentina (sovereign, provinces and corporates) and several smaller sovereigns leading the way. Other pockets of distressed debt include a number of well-publicised Western European real estate situations and a cluster of African sovereigns, such as Egypt, Nigeria, Ghana and Kenya.
Figure 7. Geographic Dispersion of Distressed Debt
Problems loading this infographic? - Please click here
Source: Man GLG. Face value of Bloomberg Global High Yield Index bonds trading at a Z Spread > 1,000bps. Index includes non-defaulted hard currency high yield bonds, with at least 1 year until maturity. As of 4 August 2022.
Default rates (Figure 8) paint a similar picture, with recent activity mainly concentrated in China property for EM corporates and weaker EM sovereigns. Russia’s invasion of Ukraine is playing out during 2022: Russian sovereign debt which was investment grade prior to the invasion, has defaulted, Ukraine has agreed with creditors to temporarily postpone foreign debt payments (and amended the terms of its GDP warrants), and several Ukrainian and Russian corporates are similarly undergoing liability management exercises. Outside of these situations, EM corporate default rates have pulled back from the temporary Covid-induced uptick in 2020. In DM, the post-lockdown ‘reopening trade’ and several well-publicised situations where retail equity investor enthusiasm for a particular stock has kept those companies afloat has brought default rates, in particular in the US, down to historic lows.
Figure 8. HY default rates over time
Problems loading this infographic? - Please click here
Source: JP Morgan as of 26 July 2022. Figures are as % of face value. CHRE = China Real Estate.
As the risk transfer swings back to corporates and individuals now that government support wanes, we see EM sovereign distress contaminating otherwise healthy EM corporates, especially those that require access to US dollar financing.
Despite the recent expansion, we anticipate that the distressed universe could become even larger and more attractive from an investment perspective. As the risk transfer swings back to corporates and individuals now that government support wanes, we see EM sovereign distress contaminating otherwise healthy EM corporates, especially those that require access to US dollar financing. Likewise, European countries face an unpalatable cocktail of energy shortages, rising prices and low growth; in short, stagflation. European corporate credit quality has been declining, especially towards latter part of the 2010s, when covenant lite debt instruments became widespread for the first time. While sovereign default in Europe may not be likely, we could see several interesting corporates whose cashflows drop enough to force a restructuring.
It is also worth noting that the macro challenges in EM mentioned above have this year been met with EM fund outflows of unprecedented proportions. EM dedicated debt funds have this year seen nearly USD20 billion of hard currency outflows year-to-date, which has eclipsed any other year of outflows in the history of the asset class (see Figure 9 below), though the intense bleeding from weekly outflows during May-July has abated in August.
Figure 9. EM Hard Currency – Annual and Year to Date Outflows
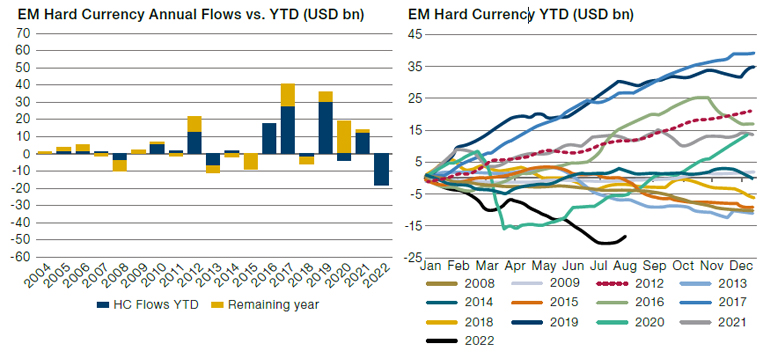
Source: Morgan Stanley as of 12 August 2022.
Sifting Through the Wreckage
How should investors approach the current distressed landscape?
Firstly, it is imperative to have a flexible capital base to be able to make the most of a broad spectrum of opportunities. Do not fight the last war. The GFC saw a large number of distressed opportunities in developed markets, especially in the US, the epicentre of the crisis. However, as we have outlined, most distressed debt is currently centred in emerging markets, with increasing opportunity in attractive EM corporates, and Europe seems to be the likeliest next shoe to drop. Capital must therefore be flexible to be deployed where opportunities arise.
Secondly, because not all distressed debt is equally attractive, investors should not deviate from fundamental principles. The best returns will be in markets with low competition for investments, with a preference for debt sitting at the top of the capital structure where protections for creditors are best. Most importantly, the underlying capacity to generate cashflows to service debt must be resilient.
Outside of periods of globalised financial crisis or dislocation which occur sporadically, we target opportunities that arise from regional or localised macro and political crises, cyclical industry downdrafts or idiosyncratic situations.
These two principles dictate where we gravitate to for opportunity. Outside of periods of globalised financial crisis or dislocation which occur sporadically, we target opportunities that arise from regional or localised macro and political crises, cyclical industry downdrafts or idiosyncratic situations, largely in hard currency international law tradeable debt (principally Eurobonds) which is periodically oversold by ‘real money’ investors.
An excellent example is Argentina, and a majority state-owned energy company. A serial defaulter on its sovereign debt, Argentina’s roughly USD70 billion Eurobond prices dropped to all-time lows in the mid-high teens cents on the dollar during the worst of the recent selloff in July, and have only recovered to low twenties prices, which significantly understate recovery values in all but the most severe restructuring scenarios. The energy company, whose credit metrics would imply an investment grade were it to be domiciled in a developed country, bears Eurobond debt of USD6.2 billion all trading at distressed prices (Figure 10). Its main problem isn’t its leverage or its cash flow generation, but rather its ability to source dollars from its country’s depleted foreign currency reserves to pay back USD debt – a good example of risk shifting back from sovereigns to corporates.
Figure 10. Argentine State-Owned Energy Company – Eurobond Mid Yield to Maturity
Problems loading this infographic? - Please click here
Source: Bloomberg; as of 22 August 2022.
Another interesting example is Turkey, where unorthodox monetary policy have translated into 5-year CDS spreads that have teetered on the edge of distressed levels (Figure 11), which call into question the country’s ability to refinance its external debt in the international capital markets. Of particular interest to international credit investors and rating agencies, is Turkey’s international reserve position, which registers at negative USD64 billion7 when taking into account the foreign currency assets of local banks held on swap with the central bank. How Turkey’s current economic crisis develops could have significant implications not just for its USD35 billion corporate Eurobond stock, comprised mostly of bonds issued by these local banks, but also for Europe, for whom the nearly USD700 billion economy is the sixth biggest trade partner8.
Figure 11. Turkish 5-Year CDS Spreads
Problems loading this infographic? - Please click here
Source: Bloomberg; as of 22 August 2022.
Conditions in Europe have recently started to give rise to significantly more attractive breeds of distressed opportunities, including a number of fallen angels.
And turning to developed markets, Europe (including the UK) sits at the nexus of a possible secular regime change in interest rates, and the grim prospect of stagflation while shackled to a belligerent Russia via weaponised supplies of oil and gas. After years of meagre and low-quality distressed opportunities, typically the most junior parts of multi-layered LBO capital structures of weak businesses, conditions in Europe have recently started to give rise to significantly more attractive breeds of distressed opportunities, including a number of fallen angels: from interest-rate sensitive residential real estate businesses in Germany and Sweden, to critical infrastructure surrounding energy transportation such as Slovakian gas transmission operators. This latter example owns strategic gas transmission infrastructure between Europe, Russia and Ukraine, which underpins EUR2.4 billion of Eurobonds – assets which are critical in these troubled times.
Figure 12. Slovakian Gas Transmission – Eurobond Yield
Problems loading this infographic? - Please click here
Source: Bloomberg; as of 22 August 2022.
Conclusion
The current distressed cycle is shaping up to potentially rival that of the GFC, which remains the benchmark by which financial crises are measured, based on the recent accumulation of global stock of distressed debt.
The recent surge in international distressed debt has dramatically increased the volume of investable alternatives. Despite this, we believe that the old principles apply. The best results come when low competition and outflows allow managers to buy distressed but cash generative businesses cheaply. The various crises of 2022 have led to selloffs and low competition – investors should now look for sound businesses in across EM and Europe to make the most of a career defining distressed debt cycle.
1. Preqin: “Vintage 2008 funds generated a median IRR of 15%”.
https://www.preqin.com/insights/research/blogs/what-we-can-learn-from-crisis-era-distressed-debt-returns
2. IMF: Global debt reached a record $226 trillion.
https://blogs.imf.org/2021/12/15/global-debt-reaches-a-record-226-trillion/
3. Source: LCD (S&P); as of June 30, 2022.
4. Deutsche Bank/ Bloomberg: https://www.bloomberg.com/news/articles/2022-06-22/deutsche-bank-looks-back-three-centuries-for-parallel-to-us-rout
5. https://www.man.com/maninstitute/global-high-yield-2022-q2
6. FT: US banks take a hit from discounted corporate bond sales, 23 June 2022
(https://www.ft.com/ content/76bbecb8-17e8-4b50-be4a-afdb54a8dc1f)
7. https://www.fitchratings.com/research/sovereigns/fitch-downgrades-turkiye-to-b-outlook-negative-08-07-2022
8. https://policy.trade.ec.europa.eu/eu-trade-relationships-country-and-region/countries-and-regions/turkey_en
You are now leaving Man Group’s website
You are leaving Man Group’s website and entering a third-party website that is not controlled, maintained, or monitored by Man Group. Man Group is not responsible for the content or availability of the third-party website. By leaving Man Group’s website, you will be subject to the third-party website’s terms, policies and/or notices, including those related to privacy and security, as applicable.