Introduction
The application of carbon constraints has become common practice in ESG portfolios. Investors often ask us how much below benchmark should carbon emissions/intensity be constrained in their portfolios. In many ways, the industry has settled on simple heuristics. For example, we have seen most investors ask for 30-50% below benchmark using historical carbon intensity data.
But is that enough to achieve our goals for a cleaner, greener world? In particular, what does it take for a portfolio1 to be aligned with net zero and the Paris Accord 1.5-degree goal?
Background
Today, carbon constraints are widely applied in practice using Carbon Disclosure Project (‘CDP’) data that discloses historical emissions of companies. In a typical low-carbon portfolio, stocks in carbon-intensive sectors (such as utilities, energy and materials) are typically penalised. Having said that, the makeup of a low carbon portfolio is typically not very different from one without the constraints as it is usually easy to achieve a portfolio with up to 50% carbon intensity/emissions lower than a typical index. In Carbon Budgeting in Quantitative Managed Portfolios2, we describe the skewness of carbon data and how lower carbon portfolios can be achieved typically by eliminating just a handful of high-emitting names in the tail exposures of the portfolio.
But is that enough?
Paris Alignment Versus Net Zero
To be ‘net zero’, a portfolio should, in theory, be relatively carbon free. This implies that a portfolio with a carbon budget 30-50% below benchmark, a current industry common practice, is inadequate for a net zero claim.
The Science Based Target Initiative (‘SBTI’) – a joint initiative between key players such as CDP, United Nations Global Compact, World Resources Institute (‘WRI’) and World Wide Fund for Nature (‘WWF’) – established requirements for the net-zero standard. One key principle behind the standard is that there should be “no net-zero claims until long-term targets are met”, which for most companies means long-term target emission reductions of at least 90-95% by 2050. Hence, to be ‘net zero’, a portfolio should, in theory, be relatively carbon free. This implies that a portfolio with a carbon budget 30-50% below benchmark, a current industry common practice, is inadequate for a net zero claim.
While a claim of ‘net zero’ is difficult to achieve in portfolios, we believe that investors can build portfolios that are on the path to net zero and show alignment to the Paris 1.5-degree goals, by customising portfolios beyond simple carbon budgeting.
So, is a carbon constraint that is 30-50% below benchmark in carbon intensity enough to be on the path to net zero?
2050 is almost 30 years away, and a company committed to net zero should “set near- and long-term targets” to achieve that goal (another tenet of SBTI’s net zero principle). There is currently data available that allows investors to explicitly express that a portfolio is on the path to net zero. As companies commit to net zero, they register forecast target future emissions by year with the SBTI3, alongside the budgeted emissions allocated. While most companies do not have projections out to 2050, investors can look at the over-/under-forecast of company emissions into the near future as an indication of whether a company is on the explicit path to net zero. The overall portfolio emissions can be further constrained to align the portfolio to SBTI’s budgeted emissions by utilising quantitative tools. Figure 1 shows two contrasting utility companies, comparing future expected emissions to budgeted (aligned) emissions.
Figure 1. Projected Emissions Versus Paris-Aligned Emissions (2012* to 2025)
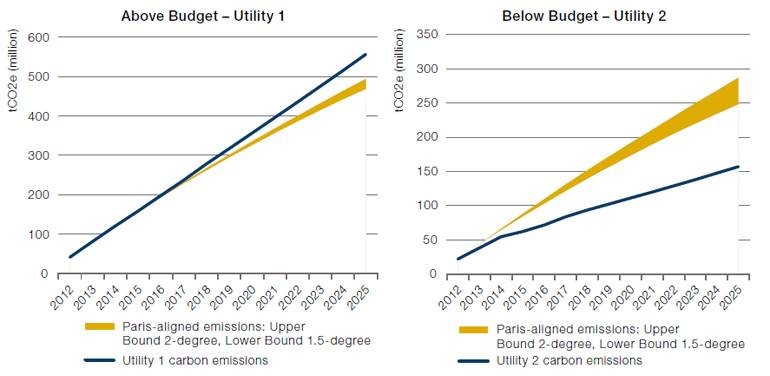
Source: Trucost, SBTI; as of 20 November 2021.
*2012 is the base year of the analysis. Alignment is measured by cumulative above/below constraints since the base year to 2025. Hence, historical emissions are important to the extent that companies are penalised should their actual emissions exceed projected emissions.
Historical Emissions Do Not Equal SBTI Alignment
While carbon constraints on historical emissions is a first step to achieving greener portfolios, a lower emissions portfolio is not necessarily more ‘1.5-degree aligned’ than a higher emissions portfolio.
While carbon constraints on historical emissions is a first step to achieving greener portfolios, a lower emissions portfolio is not necessarily more ‘1.5-degree aligned’ than a higher emissions portfolio (Figure 2). Indeed, as the figure shows, there is very little relationship between carbon intensity (historical) and 1.5-degree alignment (future). Typically, carbon intensity is measured based on a company’s previous year emissions over sales (ton/USD million). It is a backward-looking measure and does not take into account a company’s future emissions.
Figure 2. Carbon Intensity Versus 1.5-Degree Alignment
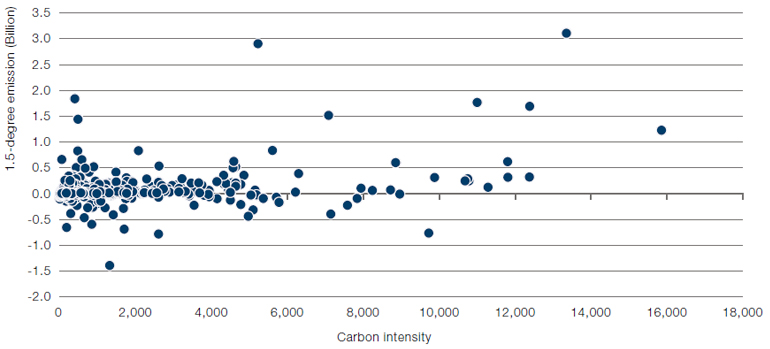
Source: Trucost, SBTI; as of 20 November 2021
For example, an SBTI-aligned portfolio can, in many cases, still be invested in energy and utilities, unlike a low-carbon portfolio that likely avoids these carbon-intensive sectors. Utility 2, an integrated electric company servicing multiple states, is in many regards a leader in the sector when it comes to alternative energy. At a carbon intensity of 450 CO2 ton/USD million (versus the MSCI World at 138 CO2 ton/USD million), the company is likely to be excluded from many low carbon portfolios (Figure 3). However, it is considered by many experts to be a leader in net zero initiatives. It recently launched a USD20 million Climate Change Investment Initiative, which includes providing investments to startups developing new technologies to reduce greenhouse gases. It has been given an A- rating by CDP, and currently derives 43.1% of its revenues from low-emission nuclear energy. Most importantly, it has significantly beaten the SBTI 1.5-degree budgeted emissions by 91 million tons of CO2 emissions, clearly doing more than its fair share of its contribution towards our greener world.
Figure 3. Key Carbon Metrics of Utility 2
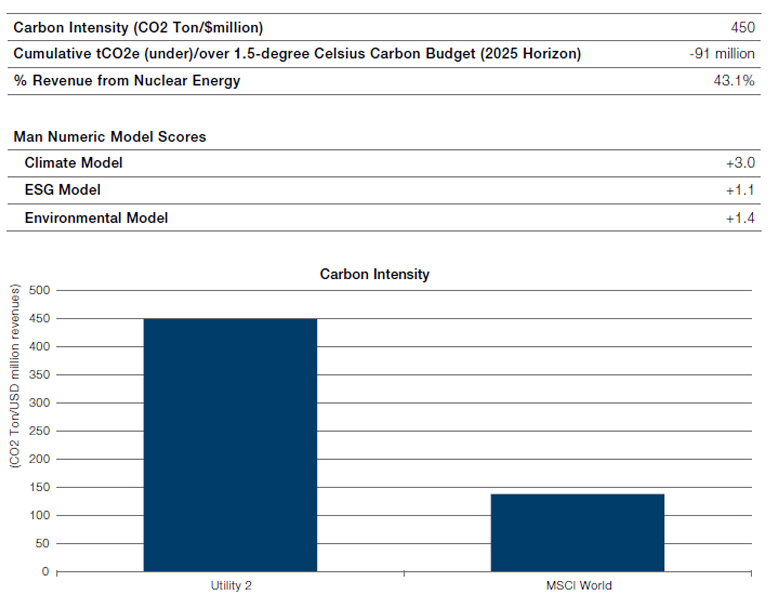
Source: Trucost; as of 20 December 2021.
We would also note that being ‘net zero’ is a much more stringent requirement than being ‘carbon neutral’. A mega-cap tech firm, for example claims of being “carbon neutral since 2007”. This is indeed a bold statement. Dig a little deeper, and the company has achieved carbon neutrality by purchasing renewable energy offsets, while it continues to emit (based on 2019 data) 5.3 million tons of CO2 emissions (Scope 1 and 2). This would, of course, be insufficient based on the SBTI’s Net Zero Standard, which explicitly requires companies to focus on “rapid, deep emission cuts” rather than achieving net zero by purchasing offsets.
Figure 4. Carbon Emissions, Intensity – Tech Firm
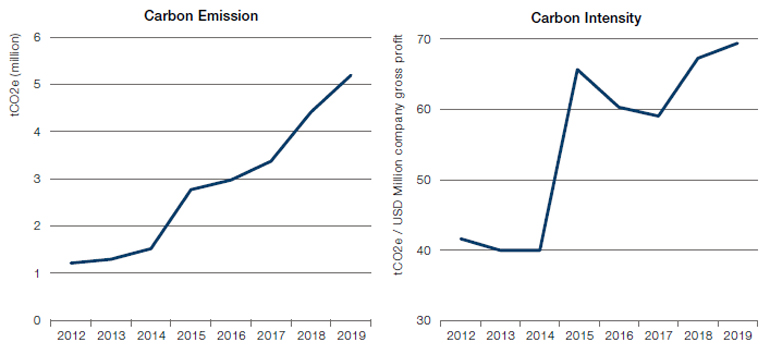
Source: Trucost, SBTI; as of 20 November 2021.
Building a Paris-Aligned Portfolio
A quick study of the SBTI 2-degree alignment data paints a picture that is somewhat bleak: only 34.3% of companies in the MSCI ACWI Index are aligned with the 2-degree goal (1.5-1.75 and 2-degree buckets), and a mere 19.5% of companies are aligned with the 1.5-degree goal (on the path to net zero, Figure 5).4 A look at emissions trajectory by sector shows a similar picture where many sectors are also not 2-degree aligned. For an ESG manager focused on making a difference, it is imperative to focus on future alignment when evaluating companies for possible investment and/ or engagement. The manager should recognise that certain companies are more predisposed to higher emissions than others. Instead of punishing the cement or steel company, it is the company’s future plans for committing resources or capital that are more important, in our view.
Figure 5. SBTI Emissions Alignment (% Count) by Various Warming Scenarios
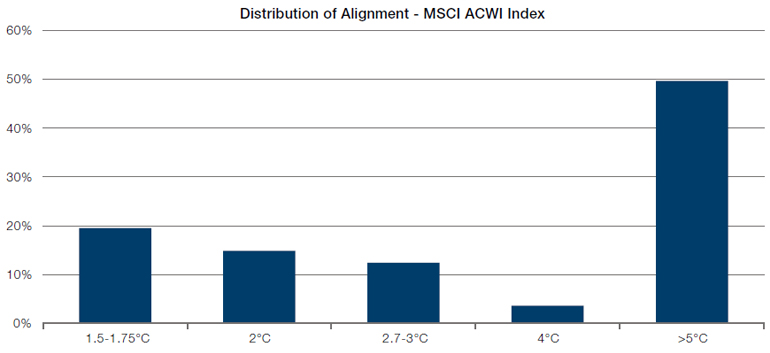
Source: Trucost, SBTI; as of 20 November 2021.
Figure 6. SBTI Emissions Trajectory by Sector/Region
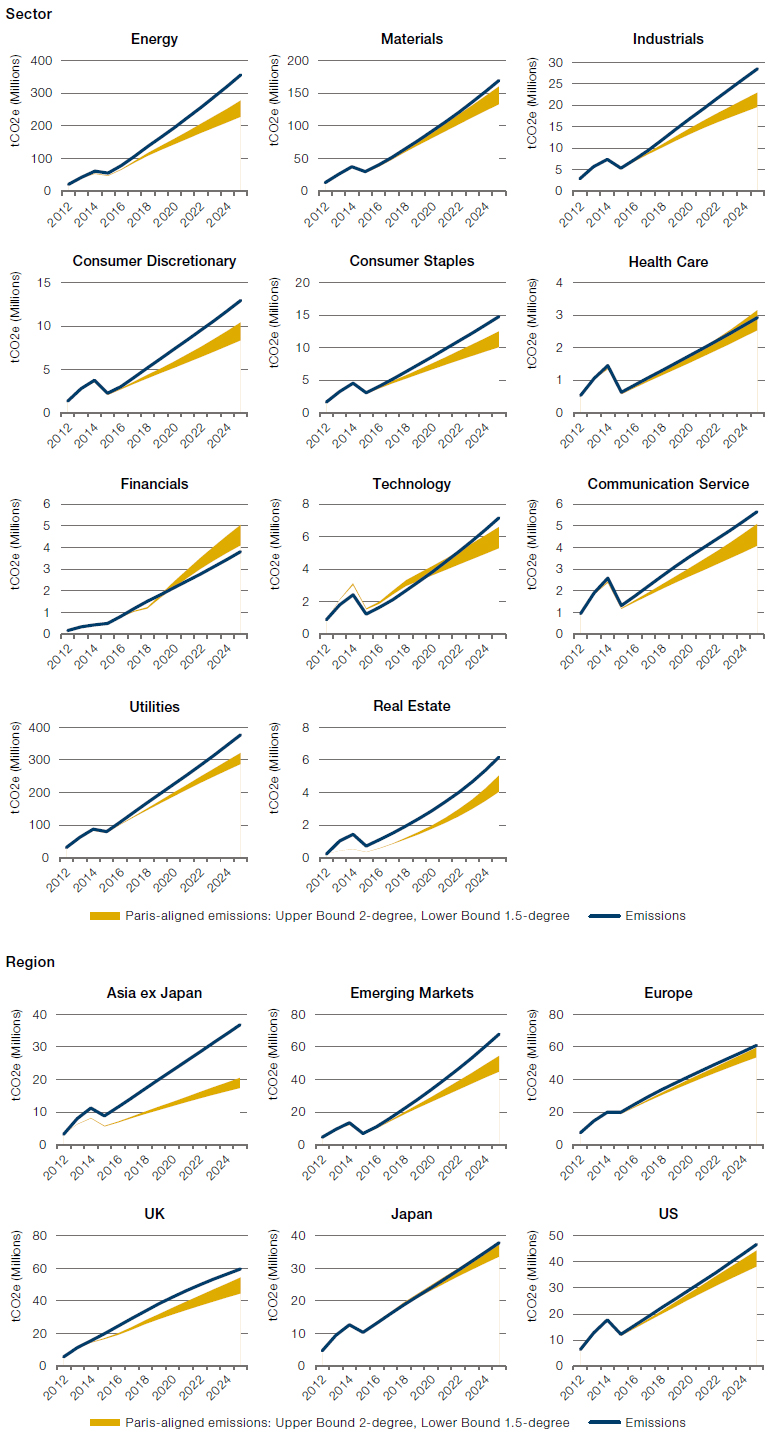
Source: Trucost, SBTI; as of 20 November 2021.
We believe it is possible to build portfolios with a 1.5-degree alignment constraint that do not have significant industry and factor biases. This is in spite of the fact that only 19.5% of companies in the MSCI ACWI Index meet this requirement.
Similar to historical carbon emissions data, careful attention also needs to be paid to the distribution of the data and the implications of applying the data as another constraint.
Most importantly, and very much like applying carbon constraints, we believe it is possible to build portfolios with a 1.5-degree alignment constraint that do not have significant industry and factor biases. This is in spite of the fact that only 19.5% of companies in the MSCI ACWI Index meet this requirement. Thankfully, the skewness in the data allows the emissions of companies above budget to be offset with companies that are meaningfully below budget (Figure 7). In addition, larger-cap companies also tend to be the companies under budget, making it easier for us to achieve the constraint for portfolios tethered to cap-weighted indices. Going forward, we believe this goal should be easier to achieve as more companies commit to having their operations net zero and as more technology becomes available to help them achieve those goals.
Figure 7. Distribution of Various Warming Scenarios: Tons CO2 (Under)/Over Budget
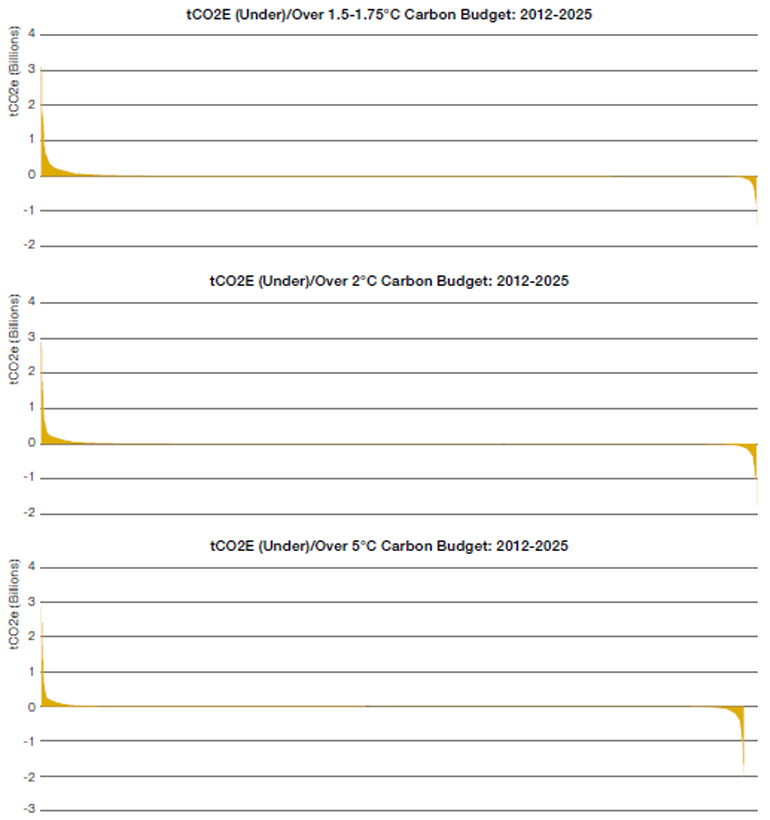
Source: Trucost, SBTI; as of 20 November 2021.
Indeed, while the weight of companies in benchmark that are 1.5-degree aligned is less than 30% (Figure 8a), we can build a portfolio that has a meaningful different projected emissions alignment (Figure 8b) compared with the benchmark. In our hypothetical portfolio, the weighted average overall carbon emissions in a 1.5-degree warming scenario is below zero (under budget), compared with the benchmark, which is more than 10 million cumulative tCO2e over the 1.5-degree budget (2025 horizon). In fact, very much like carbon constraints, our research indicates that the resulting portfolio has: 1) no meaningful sector tilts; 2) no noticeable impact on performance; and 3) no significant style drift: an interesting outcome given the percentage of companies in the universe that are Paris-aligned.
Figure 8. Hypothetical ACWI Climate Portfolio Versus MSCI ACWI Benchmark
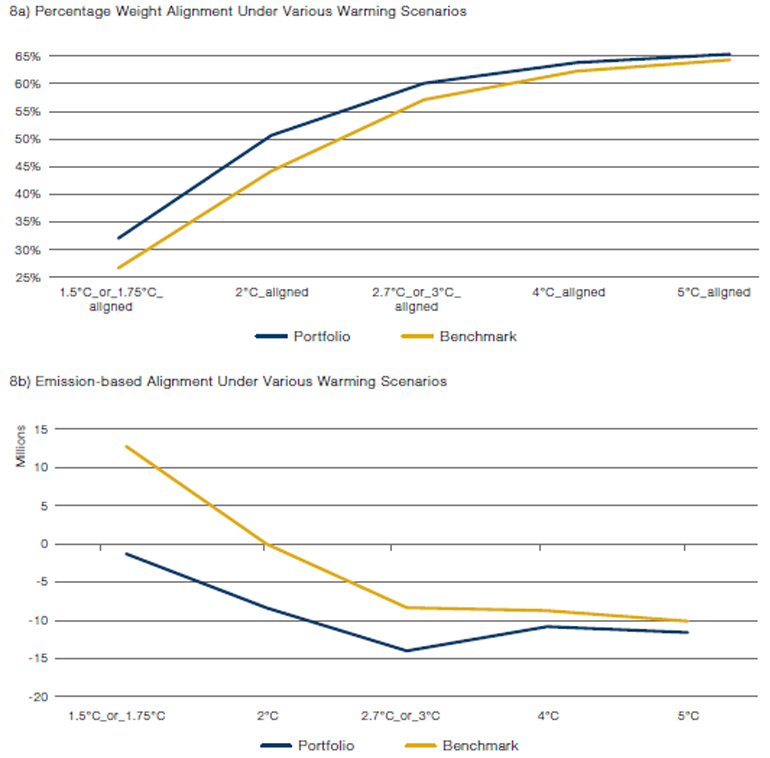
Source: Trucost, SBTI; as of 30 November 2021.
The above contains hypothetical or simulated model results that have certain inherent limitations. Unlike an actual portfolio record, simulated results do not represent actual trading. Also, since the trades have not actually been executed, the published results may have under-or-over compensated for the impact, if any, of certain market factors, such as lack of liquidity. Simulated trading programs in general are also subject to the fact that they are designed with the benefit of hindsight. There exist limitations inherent with model results. Results include simulated transaction costs, but do not include the impact of actual trading.
Conclusion
Building a 1.5-degree aligned portfolio is very much like building a portfolio with a carbon constraint, in our view. The skewness in the data allows for portfolios – that are aligned with almost no noticeable industry and factor biases – to be built.
To be successful, however, we believe investors should choose managers that: 1) have a tangible track record of building portfolios with carbon budgets; and 2) are equipped with all the necessary tools to build 1.5-degree aligned portfolios that minimise the impact on other portfolio objectives.
1. There are two types of net zero claims being made: 1) Net zero claims by corporations eliminating carbon emissions from their own operations; and 2) Net zero claims made by investment managers to eliminate emissions from their portfolio holdings. The latter is often some weighted version (based on portfolio holdings) of the former.
2.Source: Furdak, Wee; 2020 CFA Institute.
3.The SBTI budgeting process utilises two key methodologies for budgeting: SDA (Sectoral Decarbonization Approach) and GEVA (Greenhouse gas Emissions per unit of Value Added). The methodology recognises that some sectors have more available technologies for emissions reduction and hence apply different transition pathways by sector. For more information, see https://sciencebasedtargets.org/
4. As of 20 November 2021.
Hypothetical Results
Hypothetical Results are calculated in hindsight, invariably show positive rates of return, and are subject to various modelling assumptions, statistical variances and interpretational differences. No representation is made as to the reasonableness or accuracy of the calculations or assumptions made or that all assumptions used in achieving the results have been utilized equally or appropriately, or that other assumptions should not have been used or would have been more accurate or representative. Changes in the assumptions would have a material impact on the Hypothetical Results and other statistical information based on the Hypothetical Results.
The Hypothetical Results have other inherent limitations, some of which are described below. They do not involve financial risk or reflect actual trading by an Investment Product, and therefore do not reflect the impact that economic and market factors, including concentration, lack of liquidity or market disruptions, regulatory (including tax) and other conditions then in existence may have on investment decisions for an Investment Product. In addition, the ability to withstand losses or to adhere to a particular trading program in spite of trading losses are material points which can also adversely affect actual trading results. Since trades have not actually been executed, Hypothetical Results may have under or over compensated for the impact, if any, of certain market factors. There are frequently sharp differences between the Hypothetical Results and the actual results of an Investment Product. No assurance can be given that market, economic or other factors may not cause the Investment Manager to make modifications to the strategies over time. There also may be a material difference between the amount of an Investment Product’s assets at any time and the amount of the assets assumed in the Hypothetical Results, which difference may have an impact on the management of an Investment Product. Hypothetical Results should not be relied on, and the results presented in no way reflect skill of the investment manager. A decision to invest in an Investment Product should not be based on the Hypothetical Results.
No representation is made that an Investment Product’s performance would have been the same as the Hypothetical Results had an Investment Product been in existence during such time or that such investment strategy will be maintained substantially the same in the future; the Investment Manager may choose to implement changes to the strategies, make different investments or have an Investment Product invest in other investments not reflected in the Hypothetical Results or vice versa. To the extent there are any material differences between the Investment Manager’s management of an Investment Product and the investment strategy as reflected in the Hypothetical Results, the Hypothetical Results will no longer be as representative, and their illustration value will decrease substantially. No representation is made that an Investment Product will or is likely to achieve its objectives or results comparable to those shown, including the Hypothetical Results, or will make any profit or will be able to avoid incurring substantial losses. Past performance is not indicative of future results and simulated results in no way reflect upon the manager’s skill or ability.
You are now leaving Man Group’s website
You are leaving Man Group’s website and entering a third-party website that is not controlled, maintained, or monitored by Man Group. Man Group is not responsible for the content or availability of the third-party website. By leaving Man Group’s website, you will be subject to the third-party website’s terms, policies and/or notices, including those related to privacy and security, as applicable.