Introduction: The State Is Back
The historian AJP Taylor once observed that “until August 1914 a sensible, law-abiding Englishman could pass through life and hardly notice the existence of the state, beyond the Post Office and the policeman”. How times have changed. Leaving aside the fact that he overlooked 50% of the population in that breezy statement, the state has expanded dramatically. Back then tax was less than 8% of GDP in the UK (not England!). This year, the Office for Budget Responsibility expects it to be 37% of GDP. Next year it could go higher still, potentially setting the pattern for the years to come under a Conservative government with aspirations to Build Back Better, whose leader has bluntly stated that austerity is not for him. After decades of laissez-faire, free market policy, we can clearly say that “the state is back”. And it’s not just in the UK, it’s everywhere.
Only the Great Depression and World War II triggered anything like these sorts of fiscal largesse.
The global leader in stimulus has been the US. Support packages announced to date in response to Covid total 17% of US GDP according to the IMF; with the just-passed USD1.9 trillion American Rescue Plan, the total stimulus rises to 26% of GDP. If President Joe Biden gets his planned Infrastructure bill through the Senate – we are told to expect a USD2 trillion plan to be spent over four years – it would take it to a staggering 35% of GDP over time.
For context, only the Great Depression and World War II triggered anything like these sorts of fiscal largesse. And to illustrate the global nature of the fiscal response, per the IMF, stimulus plans so far announced total 16% of GDP in Australia, Japan and the UK, 15% in Canada, 11% in Germany, 8% in France, 7% in Italy, with an additional 4% from EU supranational institutions across the EU, 5% in China (Figure 1).
Figure 1. IMF Estimates of Fiscal Stimulus in Response to Covid
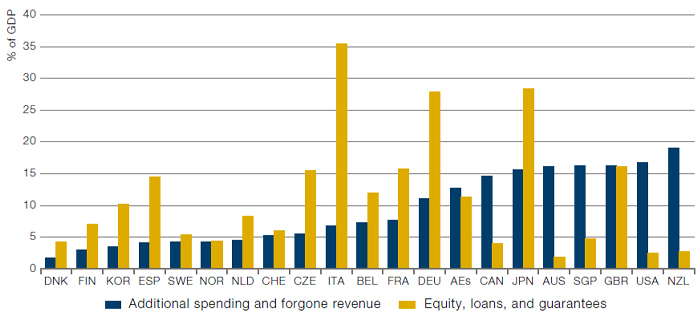
Source: Database of Country Fiscal Measures in Response to the Covid-19 Pandemic; and IMF staff estimates; as of 31 March 2021.
The wrinkle is we can’t be sure for how long and to what extent ‘the state is back’. After the publication last year of Stephanie Kelton’s Modern Monetary Theory bible The Deficit Myth and the subsequent election of a US president bent on delivering an enduring fiscal boost paid for by government borrowing, the momentum is clearly with the fiscal spend crowd. But for how long? In the UK, for example, are we to take Boris Johnson at his word and believe he has structural change in mind, with large state-funded investment programmes designed to ‘level up’ the rest of the UK to the living standards and productivity levels of the southeast of England? Or will his enthusiasm fade; will fiscal hawks in HM Treasury insist on balancing the national books and so curtail the durable, monetary-policy-enabled fiscal boost that we believe will be required to bootstrap the UK out of its sluggishness? The story in Japan over the last 30 years has been one of stop-start stimulus, with the Ministry of Finance (fiscal authority) often seeming to be acting in opposition to the Bank of Japan (the monetary authority), and vice versa. Which way will it now go?
Well, our answer to that one is, it remains to be seen. We shall only know over time, so there’s not much point speculating at this early stage. As we set out in Inflation Regime Roadmap last year, we think all the pillars are in place for an enduring regime change to a more inflationary environment but that will only happen if policy makers keep their foot firmly on the monetary and fiscal accelerators at the same time. But as we warned last year, the consequences of a more inflationary outcome on current asset allocations could be very significant, even seismic, so it’s well worth preparing for what may be ahead if policymakers do as we suggest they might.
In this article, we dip our toes into the age-old fiscal versus monetary debate and ask, what works, fiscal policy, monetary policy, both or neither? And we provide some basic analysis of how multi-asset portfolios might properly prepare for any eventual inflation.
Fiscal Versus Monetary Policy
We should emphasise at this point that we are asset allocators, not economists, but a cat may look upon a king, as the ancient saying goes, and it matters greatly that asset allocators form a view of what the impact of all this fiscal spending might be.
On one side of the aisle, we have the Keynesians who believe that aggregate demand can be managed by fiscal expansion and contraction such that an economy may reach full employment without inflation. On the other side of the aisle we have the monetarists, who say that changes in fiscal balance have no impact on the real economy beyond the short term.
- On one side of the aisle, we have the Keynesians who believe that aggregate demand can be managed by fiscal expansion and contraction such that an economy may reach full employment without inflation. High profile current proponents include former US President Barack Obama’s chief economic adviser, Harvard Professor Jason Furman, whose 2016 paper, The New View of Fiscal Policy and its Application, to some extent paved the way for the resurgence of more expansive fiscal deficits. His paper claims that far from crowding out the private sector, public investment could crowd in the private sector; that fiscal policy is “often beneficial for effective countercyclical policy as a complement to monetary policy”; that fiscal space is larger than appreciated; and that more sustained stimulus may be desirable;
- And at the extreme of the Keynesian side, we have Stephanie Kelton and the proponents of Modern Monetary Theory, who say that as long as a country controls its own currency (and is not subject to an exchange rate peg) then the government can spend as much money as it wishes on income support and national investment programmes, because government dis-saving equals private sector saving. This line of thinking says that no government with a truly sovereign currency can lose control of interest rates because the central bank can buy the bond issuance not bought by the private sector, and anyway there will be demand for the currency because of the need to pay taxes in that currency. In this view, inflation is the only binding constraint on government spending, not a certain pre-set debt-to-GDP level and certainly not a low-budget deficit;
- On the other side of the aisle we have the monetarists, led by their guru Milton Friedman and the Chicago School, who (broadly speaking) say that changes in fiscal balance have no impact on the real economy beyond the short term and a negative impact over the medium to longer term via the crowding out of private sector investment. Interestingly, they do not claim that monetary policy has much effect on real variables either, but they do claim that it has a very pronounced impact on nominal variables – i.e., inflation. They quote Friedman’s most famous mantra, that “inflation is always and everywhere a monetary phenomenon”. To maximise output and employment they advocate supply-side reform to allow the private sector to make the bulk of productive investment in the economy and advocate a smaller state with lower fiscal deficits. They deny that fine-tuning policy is possible. David Zervos (macro strategist at Jefferies) recently contributed a pithy extension to Friedman’s dictum, asserting that “inflation is never and nowhere a fiscal phenomenon”.
Complications to the debate include big questions such as: can government investment raise total factor productivity; are there threshold levels for debt/GDP beyond which future growth slows; will higher money supply growth cause generalised inflation; or will higher monetary velocity cause inflation; will money printing cause FX volatility which could cause episodic, country-specific inflation?
So, Who’s Right?
The answer lies between the two poles on average but encompasses both at certain times.
In our research on these issues, reading the literature and observing the empirical analysis, we would say the answer lies between the two poles on average but encompasses both at certain times. Both approaches have their place and it depends on circumstances which is preferable at any single point in time. For many this will be an unsatisfactory answer because the debate is so heavily politicised – you’re either for a bigger state or a smaller state, but it can’t be both. We beg to differ.
For a good review of the literature, we were pointed by our friend Gerard Minack to the IMF’s World Economic Outlook (April 2020) which summarised multiple academic studies in many jurisdictions (Figure 2) and concluded that:
- Spending-based fiscal multipliers average about 1 in year one, and remain there for three or four years – that is, one unit of increased government consumption or investment will produce one unit of increased real output in year one – with “that for public investment slightly higher than that for public consumption”;
- Tax cuts generate multipliers of around 0.25, they say;
- When interest rates are at the effective lower bound, as they are now, the IMF says that multipliers are likely to be substantially higher since there is no interest rate penalty entailing from increased government borrowing;
- Consequently, they advise policymakers “to consider adopting rules-based fiscal stimulus measures” ideally in a co-ordinated multi-country push “that would entail even greater gains”;
- Against this, we read respected market economists, such as Zervos and Hoisington Investment Management’s Lacy Hunt, who flatly state that multipliers are close to zero in the short term and negative in the medium to longer term. They cite Milton Friedman’s empirical studies (with Anna Schwartz and others) which found no relationship or a negative relationship between fiscal spend and subsequent economic output and inflation. This is held to be especially the case in highly indebted economies such as those of today.
Figure 2. IMF Estimates of Fiscal Multipliers
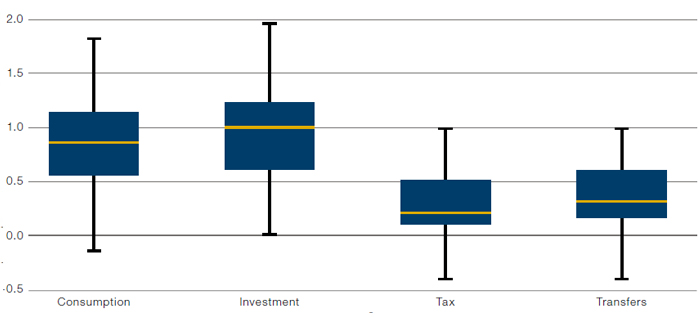
Source: Gechert and Rannenberg (2018).
Our View Today
While we are not economists, nor are we politicians, so our views on what should or could be done is irrelevant. What is relevant is what we think the political narrative might be, and therefore which policies might be pursued.
We think the narrative goes something like this. There is a growing consensus that we are faced with an under-employed global economy; where declining trend growth has almost kept pace with falling interest rates thus reducing the ability of rate cuts to stimulate demand; and where there is a glut of savings which goes to unproductive use in financial markets and not the real economy; which could therefore really use a large dose of fiscal stimulus to bootstrap it out of its torpor.
In a more fully employed economy with scarce resources, the narrative goes, one should strongly lean towards more supply-side reform and a smaller role for the state. But that’s not where we are now and the policy prescription of at least the last 13 years since the Global Financial Crisis (and before) has done very little to address the growing imbalances of wealth and income or to stimulate productivity enabling investment. Central bank support is vital to facilitate this investment surge for both the private and public sectors in order to keep a lid on market interest rates, without which already high debt loads would produce crippling debt service bills. Thus, where we are today requires both monetary and fiscal support in large size.
The challenge in the next two or three years will be to see whether the authorities keep their foot on the gas on both fronts. This would be about more than simply filling the demand hole caused by the pandemic.
Clearly this is precisely the policy prescription that is being delivered. The challenge in the next two or three years will be to see whether the authorities keep their foot on the gas on both fronts. This would be about more than simply filling the demand hole caused by the pandemic. Politicians may feel the need to turbocharge public and private sector investment, not just in green infrastructure (though that’s clearly the highest priority) but also in an agenda that raises real incomes for a large proportion of the electorate – and we use that word advisedly.
A change in the inflation regime? To the extent that politicians and central bankers do keep their foot on the gas, we would expect a broad-based and durable recovery in inflation expectations which could alter the investment landscape quite profoundly. Our Fire & Ice framework has set out at length over several years why equities and bonds are negatively correlated (but both trend higher) when the world flips back and forth between periodic bouts of deflation fear and reflationary policy response, backed with ongoing large scale asset purchases. Now, however, the fiscal cavalry has arrived, backed by the central bank artillery. If there was ever a time when the regime could change to an inflationary one, this would be it.
The Case for Commodities
Which brings us to look at commodities. Over the long run, they have weak real returns and drastically underperform paper assets. As people say, if you are long commodities you are short human ingenuity, and we agree. However, in our academic paper The Best Strategies for Inflationary Times (co-authored with Professor Campbell R. Harvey from Duke University and Man AHL’s Otto van Hemert), we examine 34 inflationary episodes since 1926 in the US, the UK and Japan to see how asset prices fared when inflation accelerated from 2% to 5% or higher. The results are quite comprehensive. Total annualised real returns to 10-year Treasuries in inflations was -5%; to US equities -7%; to US investment grade -7%; to US high yield -7%. Paper assets have consistently failed to hold their value in inflations. Commodities, however, are a different story. They prosper in inflations, very consistently and very broadly. Our commodity aggregate1 was on average up 14% in real terms in inflations; and every commodity subcomponent had positive real returns, ranging from 7% annualised for agriculture and livestock to 19% for industrials and even more for energies. Precious metals also do very well.
Interestingly, we found, most commodities had negative real annualised returns in non-inflationary periods, and this is most likely why they are so unpopular among institutional investors. We just haven’t had much inflation during the working lives of most money managers around the world, so there has never been a role for commodities in portfolios that have generally prospered from their large bond and equity allocations.
This prompted us to do a little exercise to see just how unpopular commodities are among big money managers and the results were (to us!) fascinating. Looking at the 20 largest asset owners in the world – mainly sovereign wealth and very large pension funds – we found published asset allocations for 13 (Figure 3). Just one large plan has an explicit commodities exposure – and that was a 2% allocation. True, seven of 13 plans have a ‘Real Assets’ allocation, but as far as we can tell, in six of those seven cases, that was an allocation to real estate, which we find has a decidedly mixed track record in protecting against inflations (we find average real annualised returns for US residential real estate in inflations is -2% with positive real returns just 25% of the time). Against this, the asset weighted average allocation to equities is 47% and to bonds 37%. This group clearly has very little fear of inflation but if that changed for any reason the buying power would be massive.
Figure 3. Holdings Breakdown of World’s Top 20 Asset Owners
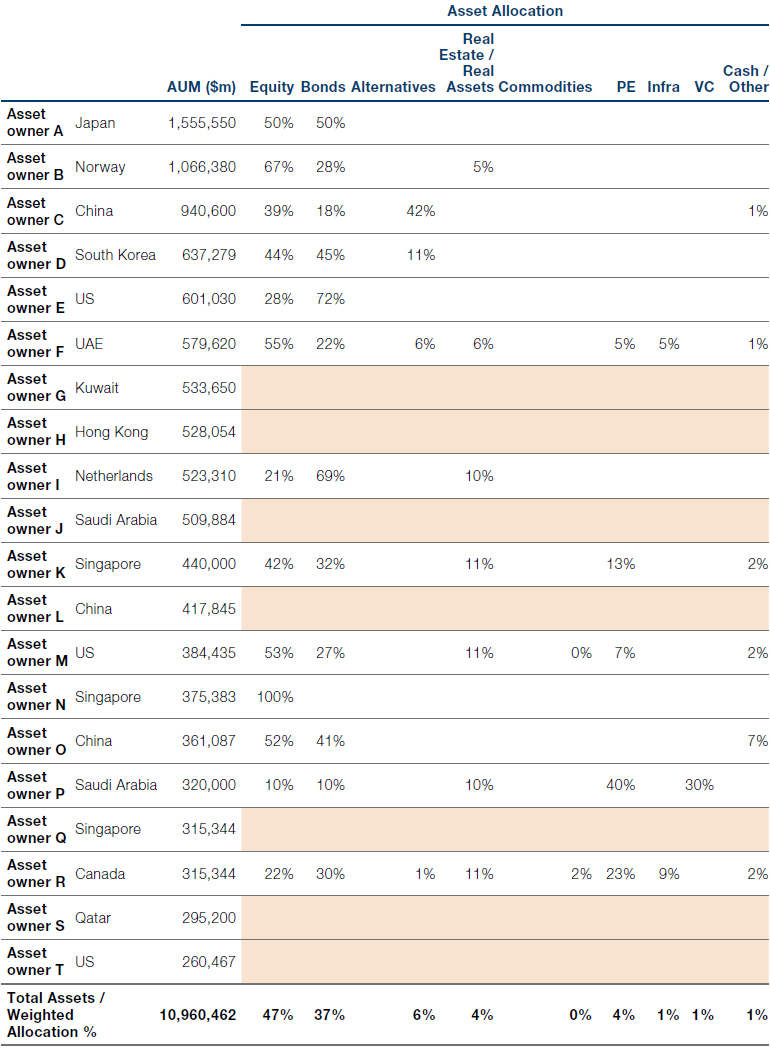
Source: 20 largest asset owners – Institutional Investor, November 16, 2020; Asset allocations – asset owners’ websites; data compiled by Man Group. Note: Shading indicates asset allocation data not found for these asset owners.
There’s not space here to develop the supply-demand case for commodities but suffice to say large scale global infrastructure rollouts are commodity intensive, and a 10-year low (last year) in commodity prices has caused very large capex cuts from the mining and energy majors such that many commodities are already in supply deficit and likely to remain so for several years. This, remember, is before the infrastructure roll out.
Conclusion – Watch Policymakers and Start to Prepare for Inflation
In wrapping up, we would simply say that Covid has accelerated a process that was already under way with a shift from a largely monetary response to secular stagnation, to a largely fiscal response supported by monetary policy. This latter has a decent chance of turning out to be inflationary. Given that risk, we believe multi asset portfolios should start to prepare strategies that can protect them from inflation better than their existing allocations to equities and bonds. Commodities are one strong candidate, in our view.
1. An equally weighted, monthly rebalanced portfolio of front-end futures in copper, gold, silver, platinum, wheat, corn, soybeans, cocoa, cotton, coffee, sugar, cattle, hogs, Brent oil, WTI oil and heating oil.
You are now leaving Man Group’s website
You are leaving Man Group’s website and entering a third-party website that is not controlled, maintained, or monitored by Man Group. Man Group is not responsible for the content or availability of the third-party website. By leaving Man Group’s website, you will be subject to the third-party website’s terms, policies and/or notices, including those related to privacy and security, as applicable.