Introduction
Integrating responsible investment (‘RI’) into a portfolio is, let’s be honest, not without its challenges. There are certainly grey areas when it comes to RI: there may be differing views as to what constitutes a ‘good’ company. How should a portfolio manager invest if a company is strong on ‘E’, but poor on ‘S’ on the ESG scale? Does engaging with a ‘bad’ company make it investible?
In this paper, we review the various RI integration approaches – exclusion lists, constraint-based and combined (where an ESG signal is mixed with other factors) – that can be used to incorporate ESG data into the investment process, and explain why, unlike the Lone Ranger’s silver bullet1, there is no direct or effortless solution to this challenge.
We describe the pros and cons of each approach and explain why each meets different objectives. We look at the application of each approach to real ESG data examples and highlight why that data deserves special portfolio construction considerations. We conclude by describing what we believe is an ideal approach.
The Building Blocks
To begin with, it is important to align the philosophy of the strategy with the method employed. Is ESG front, center, and the single factor for all decisions? Or is the portfolio designed to be multi-factor where ESG is only one consideration amongst others? Having a clear understanding of the philosophical goals of the strategy should be the first step in deciding which approach to adopt.
Broadly speaking, there are three different ways to incorporate ESG data into the investment process: (i) exclusion list; (ii) constraint-based; or (iii) combined integration.
I. Exclusion List Approach
The exclusion list approach is the simplest integration method and the most broadly used. It begins with designating a list of companies that the asset owner wants to avoid based on specific ESG criteria, often based on the investor’s values. For example, one could create a list of companies – that pollute the environment, manufacture weapons or lack corporate governance structures – and remove them from the investment universe. The benefit of the exclusion list method is that it is simple and transparent.
That said, the exclusion list method forces one to make absolute yes or no decisions, which can often mask the subtleties of some corporate activities. For example, a common and uncontroversial industry excluded in ESG portfolios is tobacco. However, where does one draw the line with industries such as weapons manufacturing? Should only nuclear weapons manufacturers be excluded? What about handgun manufacturers? Figure 1 illustrates sample exclusion list categories and the company counts based on the Man Group RI Exclusion Lists.
Problems loading this infographic? - Please click here
Source: Man Group RI exclusion lists2; as of 31 March 2019.
To further muddle the issue, the exclusion list approach not only forces one to make absolute decisions on industries, but also forces one to make absolute decisions on companies that have diversified businesses. Figure 2 presents an example of companies that manufacture weapons. Companies involved in arms production, especially nuclear weapons, are mainstays in ESG exclusion lists. However, once you dig into the data, we find that things aren’t always so black and white:
- Lockheed Martin and Raytheon both derive a majority of their revenue from weapons-related sales. Should these be differentiated based on their percentage of nuclear weapons revenue (Lockheed: 10%; Raytheon: 0.2%)?
- Raytheon and Boeing have 0.2% and 2% revenue share, respectively, from nuclear weapons. What is the cut-off that should be applied to determine which ones (if any) of the two should be excluded from the investment universe?
- United Technologies can appear to be anti-ESG with a 1% nuclear weapon revenue contribution, but this is a small revenue share compared to their main business of manufacturing equipment for residential and office buildings. Should a big name in manufacturing be excluded due to its side business?
Problems loading this infographic? - Please click here
Source: @2019 MSCI ESG Research LLC. Reproduced by permission. Accessed 3 May 2019 on the MSCI Platform’s Business Involvement Screening Page.
Should a company be excluded if it has any revenues derived from defense? What threshold is high enough before a company is deemed ‘bad’? What if the company has other activities that are viewed as beneficial on other metrics, such as the most fuel-efficient fleet or a diverse and well-trained work force? Does that offset any of the negative aspects of the company?
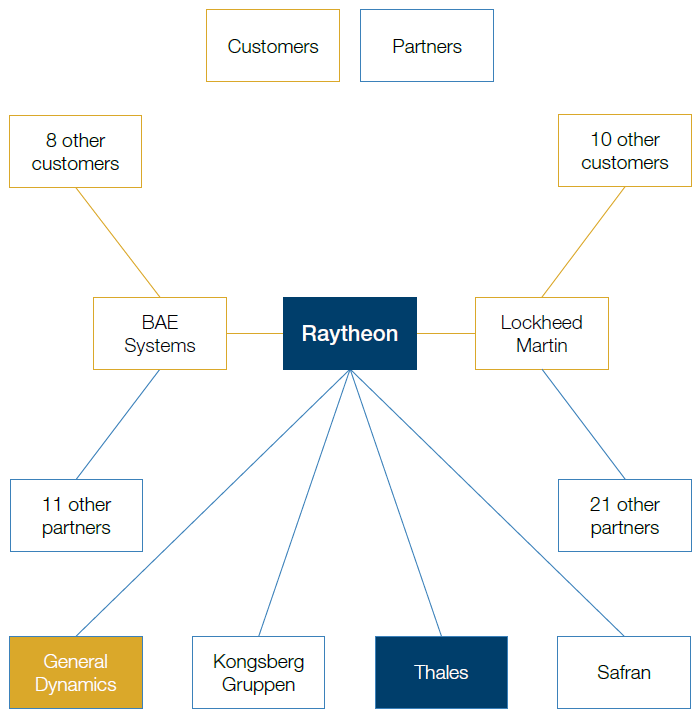
This problem further complicates itself if we look through a company’s supply chain (Figure 3). Suppose Raytheon was excluded from the investment universe due to its involvement in nuclear weapons. Raytheon sells support systems and services to BAE Systems and Lockheed Martin, which, in turn, have eight and 10 customers of their own, respectively.
Should any company that is a Raytheon customer be excluded because it is ‘supporting’ Raytheon’s nuclear weapons production? How far should one traverse the supply chain in accountability?
Raytheon also partners with four other corporations on joint ventures, ranging from Ballistic Missile Test Sites with General Dynamics to radar communications with Thales:
- General Dynamics and Raytheon operate a joint venture on a ballistic missile test site. In our view, many investors would consider this to be a weapon that they are not comfortable supporting; would this type of relationship eliminate both of these stocks from your universe?
- Thales and Raytheon have a joint venture on military radar and communication software. Many would consider this less controversial than the previous example. Considering that radar and communication software could assist in the launch of potentially controversial weapons, should these companies be part of the investable universe?
- If we determine that ballistic missile testing is not something we want to support, do we divest from General Dynamics. and Raytheon? How about Raytheon’s other customers like BAE systems and Lockheed Martin?
Figure 3. Example Stylized Ecosystem of Customers and Partners

Source: Man Numeric. Aggregated 19 April 2019.
II. Constraint-Based Approach
The second approach to integrating ESG data into the quantitative investment process is via constraints. The method begins by designating an upper or lower bound on a variable (whether binary or continuous) on an absolute or benchmark relative basis. For example, one can designate that the portfolio should not deviate more than a certain percentage from benchmark sector weights; or that the board diversity or carbon intensity of the portfolio needs to be a certain percentage better than the benchmark.
Unlike the exclusion list approach, the constraint-based approach does not require absolute decisions on particular securities. However, what is gained in implementation simplicity can be lost in transparency. The problem can be particularly acute when constraints are applied on ESG data where the data distributions are skewed/non-normal (see ESG Data: Building a Solid Foundation).
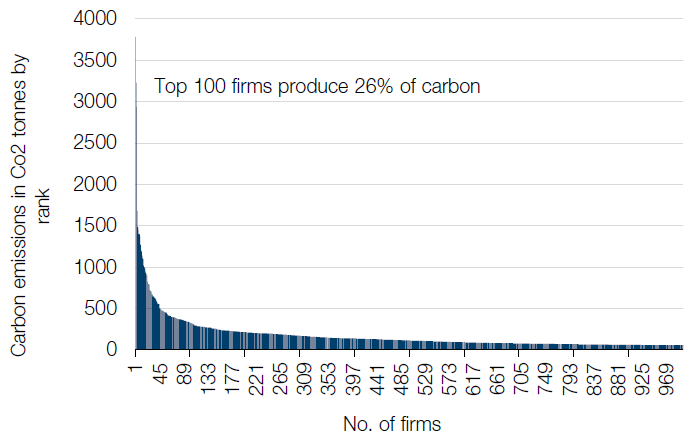
Skewness, while not a problem in itself, can lead to sub-optimal portfolio solutions in the presence of other constraints and path dependency. As an example, TruCost Carbon Intensity Data is heavily skewed (Figure 4). To meet a specified carbon intensity level, because of the nature of the skewed data, one could divest a few outsized carbon emitters (if they exist) in the portfolio or trim many positions across multiple high carbon emitters. Depending on how other constraints are set up, the portfolio optimisation process might either tilt towards the ‘sell down a few’ or ‘trim many’ solution.
Figure 4. TruCost Carbon Intensity Data Distribution

Source: Trucost slice from 29 March 2019.
Figure 5 illustrates a scenario where the portfolio manager trades off portfolio optimality with the constraint (or desired exposure) level. A by-product of tighter constraints is the increase of deviation from the optimal portfolio. The holdings overlap with optimal portfolio decreases with more stringent constraints. However, if the data is skewed, there are multiple paths to achieving a desired exposure.
Problems loading this infographic? - Please click here
Source: Man Numeric and Trucost; illustrative example of portfolio one-day snapshot.
One nuance of both the exclusion and constraint approach is whether one should design the strategy to overweight companies that score well on ESG criteria, or eliminate companies that score poorly on those measures: should screens or constraints favour good companies or minimise exposure to undesirable characteristics? This decision is one of philosophy and product positioning. However, one should not assume that eliminating the bad would automatically achieve exposure to the good.
III. Combined Approach
The third and final approach we will describe is that of combined integration. Here, the ESG model is treated as just another model within a multi-factor model framework. Depending on the weight applied to the ESG model within the multi-factor framework, one could consider how important the ESG model is versus other models within the model mix.
The benefit of such an approach is that the ESG model is put on the same footing as the other models that drive the investment process. When the ESG model is blended in, at say 20% weight, it gets the desired 20% weight in the investment decision making. However, unlike the restricted list approach, it does not guarantee that obviously ‘bad’ names are excluded from the portfolio. Likewise, unlike the constraint-based approach, it does not guarantee that a certain target ESG exposure is achieved.
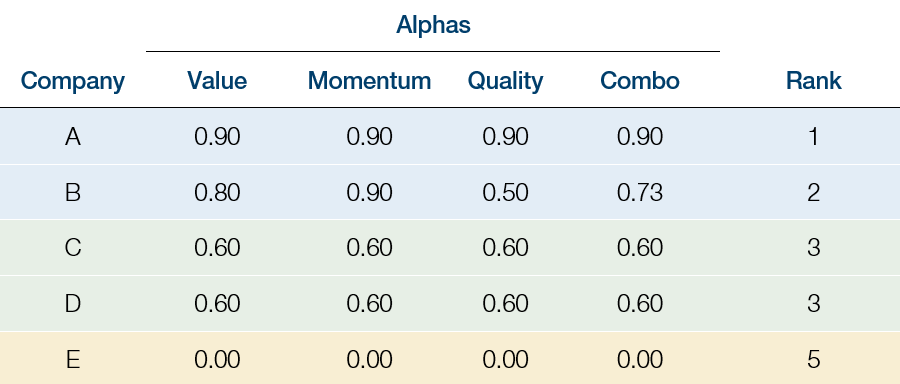
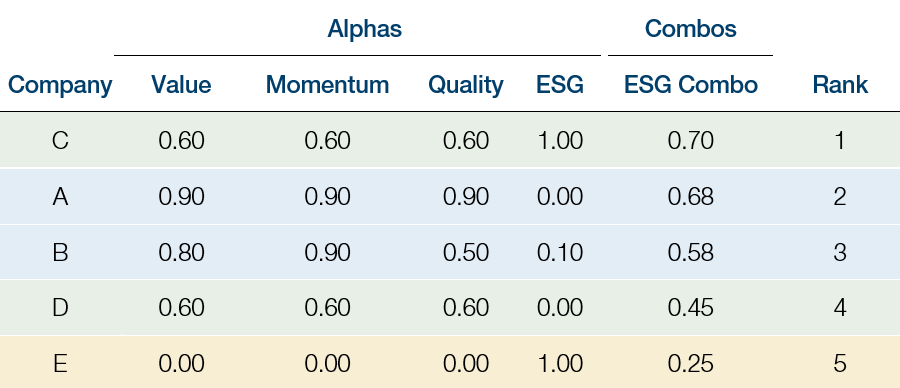
The combined method’s benefit is the ability to combine multiple views of the company, applied at the desired weights. The final combined score, a summary of the multiple views, is used to select securities for the portfolio. Figures 6a and 6b illustrate how such an ESG view can be incorporated into a multi-factor framework. The figures show the ranking of five hypothetical stocks based on the ‘Combo’ score. The Combo score is an equal-weighted average of the stock’s hypothetical component alpha scores (Value, Momentum and Quality) that range from 0 to 1. Figure 6b incorporates an ESG model, and the Combo score is now an equal-weighted average of the four scores.
Figure 6a. Multi-Factor Combined Framework Example (Stylized)

Figure 6b. Incorporating the ESG Model

Source: Man Numeric; illustrative example.
Another benefit of the combined approach is the ability to make trade-offs – average Value and Momentum scores can become investable by good ESG scores, while excellent Value and Momentum scores can be uninvestable if the ESG scores are bad enough.
- Companies C and D are equally-ranked in Figure 6a but C’s superior ESG score makes it far more attractive than D, as shown in Figure 6b;
- Company A, the highest ranked company in Figure 6a, remains attractive despite its poor ESG score;
- Conversely, a company like E that has the best ESG score is unlikely to make it into the portfolio if it does not look attractive on other measures.
While we described the combined method in the context of a multi-factor framework, a different but related implementation is to apply a ‘sleeve’ approach to ESG. Here, instead of blending the ESG model within a multi-factor framework, the ESG model is managed independently with a certain amount of capital allocated to it.
There are pros and cons of the ‘sleeve’ approach compared with the ‘blended’ approach. The primary benefit of the sleeve approach is ease of implementation and guaranteed exposure to the signal, while its implementation might not be the most efficient use of capital (e.g., the portfolio will own low ESG names in non-ESG sleeves).
While the combined method is explicit in how much ESG weight is blended in, the final resulting portfolio exposure to ESG can vary due to other portfolio construction considerations such as model correlation, transaction costs and individual model turnover. In general, low model correlation, high transaction cost and high model turnover lead to lower intended model exposures. As such, each implementation needs special consideration and may have to be adjusted accordingly.
What’s Ideal?
None of the approaches are superior to the other, in our view. We believe that one ESG integration method alone is not sufficient to form a complete ESG picture for a sector or company. Indeed, we are of the view that any robust RI offering should consider all three approaches.
The exclusion list approach could be applied in ESG-oriented offerings or at client direction. For ESG-oriented offerings, exclusions could target companies an ESG investor may stay away from (e.g., tobacco, controversial arms & munitions).
The constraint-based approach could be employed for certain ESG variables, where the goal is to achieve a particular target outcome (e.g., carbon intensity of portfolio to be a certain percentage below the benchmark.)
Finally, the combined integration method could include an ESG model as part of a comprehensive multi-factor approach. This would reward or punish companies based on a variety of ESG metrics, but also make the decision in conjunction with other quantitative metrics (e.g., Value or Momentum).
This comprehensive approach is flexible; it allows for the creation of an ESG portfolio with the desired characteristics, which can then be adjusted if ESG priorities change.
Conclusion
Creating a robust ESG framework that generates alpha and improves the portfolio’s risk characteristics is complex for both asset owners and asset managers. Asset owners have a diverse set of goals when implementing ESG while asset managers have two challenges: how to create an ESG signal and then how to incorporate it into the portfolio.
Some challenges for an asset owner include: defining RI values and objectives; deciding whether to make the decisions internally or outsource to a manager; how strictly to adhere to the value set; if the decisions should be made in an absolute or relative perspective; and finally and most importantly, can these decisions be made while maintaining the fiduciary duties to their stakeholders?
The asset manager, on the other hand, has to solve two primary problems: the first is to create a robust methodology to evaluate a company’s ESG characteristics; and the second is to integrate RI into portfolios.
With regards to the former challenge, ESG data itself is subjective and messy, making good signals hard to construct. This requires an investigation and synthesis of the different ESG measures provided by various providers of ESG data, which we have explored in our previous work.
Once that challenge is overcome, we believe that a full integration of all available tools – using exclusion lists, constraints and signal combinations – is the best method, albeit far from being a silver bullet. This should allow for the implementation of a systematic, repeatable RI investment process, which should, in turn, produce a robust RI portfolio.
1. The Lone Ranger typically arrived from nowhere, overcame evil and departed, leaving behind only a silver bullet and echoes of “who was that masked man?”
2. Man Group’s RI Exclusions List (“RI Exclusions”) represents a proprietary list of sectors and companies implemented in certain Man RI/ESG strategies. On a quarterly basis, the Man RI exclusions committee uses a third party vendor to identify companies whose activity is associated with these four categories and reviews these companies using internal parameters to determine if they should be excluded based on the activity of the company.
You are now leaving Man Group’s website
You are leaving Man Group’s website and entering a third-party website that is not controlled, maintained, or monitored by Man Group. Man Group is not responsible for the content or availability of the third-party website. By leaving Man Group’s website, you will be subject to the third-party website’s terms, policies and/or notices, including those related to privacy and security, as applicable.