Executive Summary
We believe there is an overlooked opportunity in EM Small Cap.
Many investors seek to diversify their exposure to developed markets (DM) by allocating to emerging markets (EM). Yet while larger-cap EM strategies may be popular, we believe there is an overlooked opportunity in EM Small Cap. To illustrate these opportunities, we compare the MSCI EM Small Cap Index (an index capturing small-cap representation in EM) with the MSCI EM Index (which captures large and mid-cap EM securities).
Through this analysis, we highlight the potential benefits of EM Small Cap strategies, including:
- Portfolio diversification compared with larger-cap EM strategies;
- Balanced EM country/sector composition, which we believe is particularly important in managing EM’s concentration in Asia;
- Greater exposure to domestic-demand growth and, on average, lower exposure to foreign revenue sources;
- Historically lower volatility with better returns relative to the MSCI EM Index;
- The potential to outperform the benchmark, supported by active managers’ historical performance and market inefficiencies.
1. Diversification to the MSCI EM Index
Using monthly USD returns, we calculated rolling 12-month correlations between the MSCI EM Index and MSCI EM Small Cap Index (Figure 1). Since the start of the COVID-19 pandemic, the MSCI EM Small Cap Index has become less correlated with the MSCI EM Index, demonstrating the differentiation between the two indices. Although the correlation has increased since its lows around 0.6, we expect it to remain meaningfully below its longer-term average given some of the features we discuss later in this paper – particularly the MSCI EM Small Cap Index’s country and sector diversification and lower reliance on international revenues.
Figure 1. Rolling 12-Month Correlation of MSCI EM Index and MSCI EM Small Cap Index (January 1996 - September 2022)
Problems loading this infographic? - Please click here
Source: MSCI and Bloomberg; as of 30 September 2022.
2. More Balanced Exposure
Diversified Country Composition
The larger-cap universe has significantly more exposure to China than the small-cap index.
We look at the country composition of the EM indices and see that EM Small Cap offers more balance than the EM Index (Figure 2). This is important in both managing Asia concentration and maintaining a balanced exposure in EM. With Chinese companies accounting for approximately one-third of the MSCI EM Index, even after the significant selloff in the past two years, the larger-cap universe has significantly more exposure to China than the small-cap index.
Figure 2. Country Breakdown of MSCI EM Index and MSCI EM Small Cap Index
Problems loading this infographic? - Please click here
Source: MSCI and Man Numeric; as of 30 September 2022. Based on the MSCI Country Classification Standard.
The disparity in returns following country-specific regulatory changes highlights the benefits of having a balanced country exposure.
Concentrated exposure in any single country raises concerns of country-specific risk. Given the EM Index’s significant exposure to China, we look at returns since October 2020 – just before a series of regulatory changes were introduced in China. From October 2020 through September 2022, the MSCI EM Small Cap Index (which is more insulated from such policy risks given the country’s lower weight in the index) significantly outperforms the MSCI EM Index (Figure 3). The disparity in returns following country-specific regulatory changes highlights the benefits of having a balanced country exposure.
Figure 3. Annualised Returns, 31 October 2020 to 30 September 2022
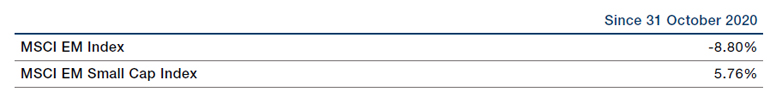
Source: MSCI and Bloomberg; as of 30 September 2022.
Diversified Sector Composition
Along with a more balanced country composition, the MSCI EM Small Cap Index offers greater sector diversification than the MSCI EM Index. Looking at their GICS sector composition, the EM index has more concentrated exposure to a handful of sectors, such as Financials and Information Technology, while the EM Small Cap Index is more evenly distributed across sectors (Figure 4).
Figure 4. Sector Breakdown of MSCI EM Index and MSCI EM Small Cap Index
Problems loading this infographic? - Please click here
Source: MSCI and Man Numeric; as of 30 September 2022.
In EM Small Cap, a larger proportion of returns are explained by idiosyncrasies, indicating it is more insulated from macro shocks.
Given that EM Small Cap has more balanced country and sector exposure, we examined whether proxies for macro drivers – such as country and sector – led to less return dispersion among the smaller-caps. We therefore looked at how much of the returns could be explained by such factors. We compare the monthly cross-sectional return explained by countries and sectors from 2007 through September 2022 (Figure 5). In recent years, the larger-caps have had a higher percentage of their return explained by country and sector; in EM Small Cap, a larger proportion of returns are explained by idiosyncrasies, indicating it is more insulated from macro shocks.
Figure 5. Percentage of Monthly Cross-Sectional Return Dispersion Explained by Country and Sector
Problems loading this infographic? - Please click here
Source: Man Numeric; as of 30 September 2022. The periods highlighted are exceptional and the results do not reflect typical performance. The start and end dates of such events are subjective and different sources may suggest different date ranges, leading to different performance figures.
3. Greater Exposure to Domestic-Demand Growth
A major appeal of investing in EM is the differentiated underlying exposure from DM. We compare the amount of domestic demand captured by the EM indices, as more domestic demand provides more direct exposure to the emerging economies.
More Domestic Revenue Sources
On average, MSCI EM Small Cap Index constituents have lower exposure to foreign revenue sources, based on the benchmark-weighted percentage of revenue coming from foreign sales. The MSCI EM Index gains 35.6% of its revenue from foreign sales, while the EM Small Cap Index takes just 27.9%.1
The EM Index has more weight in companies that derive most of their revenue from foreign sales.
We also bucket index securities by how much of their revenue comes from foreign sales (Figure 6). The EM Index has more weight in companies that derive most of their revenue from foreign sales, while the EM Small Cap Index has more in companies with revenue entirely derived from domestic sales (0% foreign sales). A larger weight to domestic sales results in the MSCI EM Small Cap Index capturing more domestic demand.
Figure 6. Benchmark Weighted Percent of Revenue from Foreign Sales
Problems loading this infographic? - Please click here
Source: MSCI, WorldScope and Man Numeric; as of 30 September 2022.
Consistently Less Reliant on Foreign Sales
Historically, the MSCI EM Small Cap Index has been less reliant on foreign sales than the MSCI EM Index too. We computed benchmark-weighted foreign sales for both since January 2010 (Figure 7). EM Small Cap has consistently drawn less on foreign sales, offering greater domestic-demand exposure. Furthermore, the foreign-sales spread between EM and EM Small Cap has widened since the start of the COVID-19 pandemic.
Figure 7. Percentage of Revenue from Foreign Sales, January 2010 - September 2022
Problems loading this infographic? - Please click here
Source: MSCI, WorldScope and Man Numeric; as of 30 September 2022. The periods highlighted are exceptional and the results do not reflect typical performance. The start and end dates of such events are subjective and different sources may suggest different date ranges, leading to different performance figures.
4. Less Volatility with Greater Returns
Typically, small-cap indices have higher volatility relative to their large-cap counterparts. This is not the case for EM, however.
Typically, small-cap indices have higher volatility relative to their large-cap counterparts. This is not the case for EM, however, where the MSCI EM Small Cap Index has historically had lower volatility than the larger-cap MSCI EM Index. We look at annualised volatility since the Global Financial Crisis and since October 2020, when the aforementioned series of regulatory changes were introduced in China (Figure 8). Over both lookback periods, the MSCI EM Small Cap Index has lower volatility than the MSCI EM Index.
Figure 8. Annualised Volatility Through 30 September 2022
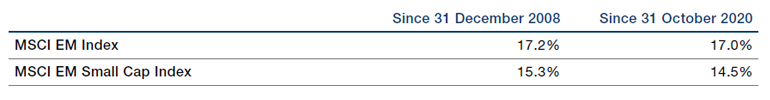
Source: MSCI and Bloomberg; as of 30 September 2022.
Despite this lower volatility, the MSCI EM Small Cap Index has had the higher returns since the Global Financial Crisis. The MSCI EM Small Cap Index has outperformed the MSCI EM Index on an annualised basis since 2008, with total annualised returns of 8.78% compared with 6.08% for the EM Index.2 The MSCI EM Small Cap Index has consistently had better returns than the MSCI EM Index, which we see when plotting cumulative returns from 31 December 2008 to 30 September 2022 (Figure 9). This track record combining lower volatility and greater returns from the MSCI EM Small Cap Index makes EM Small Cap strategies a compelling option for investors interested in EM exposure, in our view.
Figure 9. EM Cumulative Return, January 2009 - September 2022
Problems loading this infographic? - Please click here
Source: MSCI and Bloomberg; as of 30 September 2022. Rebased to 1 as of 30 January 2009. The periods highlighted are exceptional and the results do not reflect typical performance. The start and end dates of such events are subjective and different sources may suggest different date ranges, leading to different performance figures.
5. Potential to Outperform the Benchmark, with Market Inefficiencies Presenting Compelling Opportunities for Quantitative Models
Greater Weight Dispersion
More breadth is typically preferred for alpha generation. The EM Small Cap index has a wide breadth of securities compared with the EM index, which is heavily concentrated in a handful of securities. Due to the concentrated nature of the larger-cap MSCI EM Index, outperforming that benchmark highly depends on correct positioning in the mega-cap space: the top-10 securities in the MSCI EM Index account for 21% of the overall index.3 This is actually lower than it has been in the past: before the US began tightening monetary policy, inducing a risk-off selloff, the top-10 weight in the MSCI EM Index once reached more than 30% (Figure 10). This is a structural headwind for active managers, in our view. Contrast this with the MSCI Small Cap Index, in which the top-10 securities have consistently represented less than 5% of the overall index. We believe the greater weight dispersion in the MSCI EM Small Cap Index gives active managers more opportunity to develop a differentiated EM Small Cap strategy.
Figure 10. Index Weight of Top 10 Constituents, January 2012 - September 2022
Problems loading this infographic? - Please click here
Source: MSCI and Man Numeric; as of 30 September 2022.
More Excess Returns from Active Managers
We use the eVestment Database to calculate excess returns relative to the manager-preferred benchmark over trailing 1-year, 3-year, 5-year, and 10-year periods (Figure 11). The trailing median excess return from EM Small Cap managers has consistently exceeded that of EM managers. This historical record indicates that institutions looking for EM exposure can receive more excess return from EM Small Cap strategies.
Figure 11. Trailing Active Manager Median Excess Return
Problems loading this infographic? - Please click here
Source: eVestment Global Database and Man Numeric; as of 30 September 2022.
Market Inefficiencies Yield Higher Model Efficacy
With many smaller, less market-efficient constituents, we believe the EM Small Cap universe presents a compelling opportunity to unlock alpha.
The additional returns that active managers have generated with EM Small Cap strategies align with the results we see when testing internal model efficacy across the EM universe. We measured quintile (top 20% minus bottom 20%) model spreads for three groups of EM stocks, bucketed by capitalisation rank from January 2012 through September 2022. The back-tested returns were highest for the smallest companies (capitalisation rank of at least 1000), indicating that the smaller-cap names have the most potential for alpha generation (Figure 12). There may be less alpha to capture in the EM index due to its concentrated exposure in a handful of larger, more liquid, and market-efficient names. With many smaller, less market-efficient constituents, we believe the EM Small Cap universe presents a compelling opportunity to unlock alpha.
Figure 12. Average Monthly Quintile Spread by Capitalisation Rank, January 2012 - September 2022
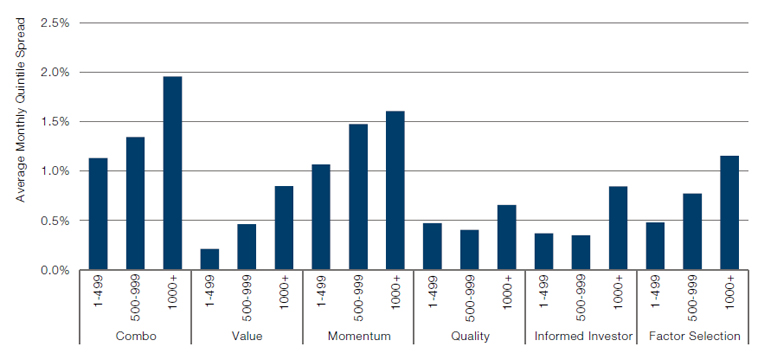
Source: Man Numeric; as of 30 September 2022. Please see the important information linked at the end of this document for additional information on hypothetical results.
Conclusion
Our goal in this paper was to outline the potential benefits of investing directly in EM Small Cap strategies relative to other EM strategies. We find that EM Small Cap is differentiated from broader EM strategies in terms of country/sector exposure, domestic-demand growth, performance, and opportunities for active managers. With more insulation from global macroeconomic changes and less-efficient markets, we believe EM Small Cap strategies present a compelling opportunity for investors.
1. Source: MSCI, WorldScope, and Man Numeric; as of 30 September 2022.
2. Source: Bloomberg; as of 30 September 2022.
3. Source: MSCI; as of 31 October 2022.
You are now leaving Man Group’s website
You are leaving Man Group’s website and entering a third-party website that is not controlled, maintained, or monitored by Man Group. Man Group is not responsible for the content or availability of the third-party website. By leaving Man Group’s website, you will be subject to the third-party website’s terms, policies and/or notices, including those related to privacy and security, as applicable.