Introduction
In recent weeks we have been reminded, yet again, that bank equity and credit are subject to risks far beyond loan portfolios.
Following the Global Financial Crisis (GFC) of 2008, one thing was apparent to most investors and bank analysts: bank shares, especially in Europe, were quite likely to experience a multi-year period of low returns punctuated by extreme volatility. Equally obvious was that poor returns would be a result not of low-quality loan portfolios, but rather an extended period of ever-rising capital ratios and more draconian liquidity and funding requirements. Looking closely, one could observe that loan portfolios were in good shape – with non-financial corporate leverage relatively low, security value relatively high and interest expense at near all-time lows.1 These portfolios, of course, could be securitised and sold to investors to offset the regulatory capital applied to them.
We were not the only ones to make this connection. From 2010-2014, European bank issuance of regulatory capital securitisations expanded substantially.2 In short, investors received high-quality cash flows indirectly linked to low-risk corporate loans; banks, meanwhile, were able to mitigate the impact of relatively high portfolio risk weights and therefore capital charges. Since the GFC, risk transaction returns have in aggregate easily outpaced those of every other part of the banking capital stack3– despite not benefiting from any of the “high return” service businesses on which banks focus.
In recent weeks we have been reminded, yet again, that bank equity and credit are subject to risks far beyond loan portfolios. Unsurprisingly, we’ve been inundated with questions and comments implicitly assuming credit risk-sharing (‘CRS’) transactions must be suffering. In fact, in our experience the market for risk sharing is performing normally, with several deal closings expected at month end and rather small implied changes to prices for outstanding transactions.4
For those invested in or considering investing in CRS, we believe a review of what has taken place this month and how it impacts the market is in order. Additionally, we believe an explanation of the risks inherent in risk-sharing transactions will help those investors trying to understand the market better.
Eleven Days in March
SVB had no more room for manoeuvre: the next sale would be its last.
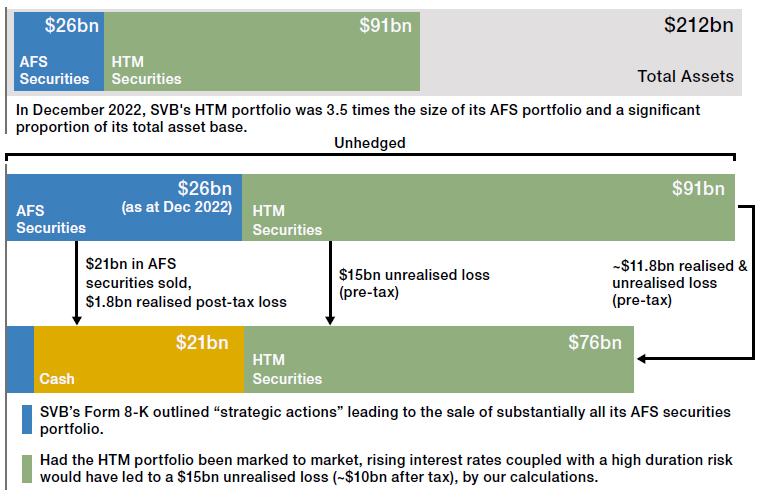
On Wednesday 8 March, a share in the holding company parent of California lender Silicon Valley Bank (‘SVB’), then the 20th largest depository in the United States, closed on the Nasdaq market at $270. 40 hours later, the bank was put into receivership by the California Department of Financial Protection and Innovation and the Federal Deposit Insurance Corporation. During that period, roughly 25% of the bank’s deposit base had fled and many more depositors had issued wire transfer orders that were never executed.5 What prompted the run, apparently, was a press release describing the sale of the bank’s available for sale (‘AFS’) bond portfolio and capital raising. Nonetheless, SVB had deeper problems: it held on its balance sheet a hold to maturity (‘HTM’) bond portfolio several times larger than the AFS portfolio (Figure 1). With depositors demanding to withdraw cash in an amount well in excess of the proceeds of the AFS portfolio sale, it was clear that a sale of at least some part of the HTM portfolio would be necessary to meet obligations. And, according to US Generally Accepted Accounting Principles (‘GAAP’), the sale of HTM assets requires that all similar HTM assets be moved to the trading book and marked to market value. SVB had no more room for manoeuvre: the next sale would be its last.
Figure 1. SVB’s Asset Portfolio as of December 2022

Source: Man GPM based on data from SVB Form 8-K as of 8 March 2023 and S&P Capital IQ as of December 2022.
There are basically two regulatory regimes in the US, in our view: those for the top banks and those for all the others. Large-bank regulation in the US largely looks like regulation in Europe and the rest of the world. The prodigious banking lobby in the US, however, has fought many a rear-guard action to prevent the country’s roughly 8,000 community and regional banks from being forced onto what are referred to as the Basel – after the Bank for International Settlements in Basel, Switzerland – rules.
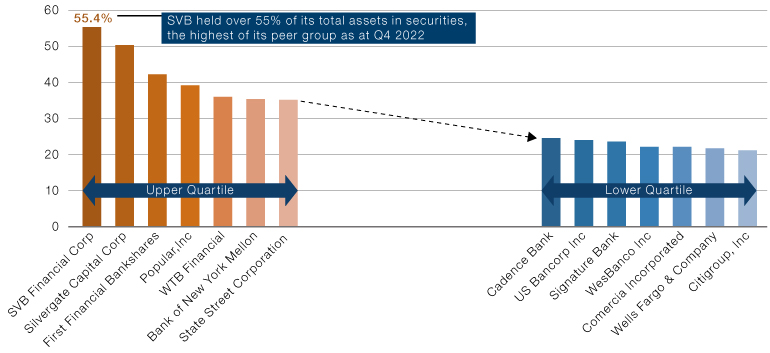
Although there are numerous gaps between Basel’s recommendations and the US Regulation Q, the fact that 99% of American banks (those in Category IV) are basically not subject to any of the primary international capital and liquidity ratios6 is the most salient, we believe. Despite a deposit franchise sitting – along with 11 other banks – just under the $200 billion threshold, in our view SVB basically acted like a Californian bank did in the 1850s: taking in deposits, almost all of which were uninsured, and lending out to a surprisingly narrow set of borrowers.7 When deposits came in faster than they could make loans, SVB management just bought securities – mostly Treasuries and Agencies. At year-end 2022, bonds made up roughly 55% of the bank’s assets – roughly double the equivalent proportion for most regional and community banks (Figure 2).
Figure 2. Proportion of Banks’ Total Assets Held in Securities

Source: Man GPM based on S&P Global Market Intelligence; as of 31 December 2022. The organisations and/or financial instruments mentioned are for reference purposes only. The content of this material should not be construed as a recommendation for their purchase or sale.
Securities, due to their inherent tradability, present banks’ asset/ liability managers with a quandary.
Securities, due to their inherent tradability, present banks’ asset/liability managers with a quandary. The price variability of the security does not match the lack of variability of the deposit used to acquire the security. Managers at SVB and many other US banks have increasingly taken what appeared to be the easy way out of their dilemma – they placed the securities in the AFS and HTM accounting “buckets.” Changes in the prices of AFS securities do not flow through the income statement; instead they arise under the Accumulated Other Comprehensive Income line in the equity section of the balance sheet. So AFS securities have no income-statement impact, but they do have an impact on equity. Meanwhile, HTM securities neither mark through the income statement nor the balance sheet; they just stay fixed at par. A banker would only choose this accounting treatment, in our view, if they prioritised the volatility of periodic reporting of earnings over financial strength and transparency.
There is an irony to SVB’s efforts to avoid regulation. Had regulators asked SVB to calculate its Net Stable Funding Ratio and High-Quality Liquid Asset (‘HQLA’) Ratio, they would have seen that both looked quite impressive. But had regulators reduced the credit given to uninsured corporate deposits from 100% to 50%, as they do with financial deposits, and had they written securities accounted for under the HTM method out of the HQLA definition – both moves being entirely appropriate – SVB would have looked spectacularly risky.8
Precisely nine days after the failure of SVB, the Swiss National Bank and the Swiss financial supervisor FINMA forced the sale of Credit Suisse (‘CS’). To close the transaction, the Swiss government took steps to write down CHF17 billion of Additional Tier 1 bonds to zero, effectively creating CHF17 billion of common equity, just before the sale.9 Over the past six months, we saw a pattern of deposit flight play out at CS that was eerily similar to that at SVB. The pace was much more subdued, but in many respects it was also more relentless and less obvious as to why depositors were so scared. Regulatory capital and liquidity at CS were, in our view, miles ahead and better than at SVB. In fact, we don’t think it’s an overstatement to suggest CS was one of the best capitalised and most liquid banks in the world. But, just like at SVB (and Signature Bank in the US in the interim) there comes a point at which even the best capitalised and most liquid bank cannot withstand a reduction in liabilities without destroying substantial equity value.
Perhaps most importantly and most critical for regulators, deposit contraction led to equity declines as investors discounted increasing franchise destruction. With shares trading below 20% of book value, it seemed inevitable that creditors and counterparties would stop doing business with CS. Starting in early March, this mass exodus turned darker, with CS senior unsecured credit spreads increasing wildly.10 Appropriately, in our opinion, regulators viewed spreads as a clear indicator of the non-viability of the bank, leading to the forced sale on Sunday 19 March.
When underwritten prudently, loan portfolios – as opposed to single loans – should be both predictable and low risk.
Bank Distress and the CRS Market
CRS transactions are designed to shift the credit risk of discrete loan portfolios from issuer to investor. These loan portfolios are backed by corporate and household borrowers that are bankruptcy remote from issuers. Nonetheless, there are important aspects to the CRS market that investors should understand to appreciate the risks they bear when underwriting these portfolios.
Again, the primary risk to CRS investors is credit risk. When underwritten prudently, loan portfolios – as opposed to single loans – should be both predictable and low risk. Losses can and do occur, but they should largely be subsumed by the spread income earned from other loans. Issuer financial stability should largely or entirely be irrelevant to borrower credit risk.
A secondary risk borne by investors in CRS, as with all securitisations, relates to the capital backing a trade. While there are various structures common in the market, cash proceeds from a deal go to one of two positions: a) off-balance sheet in a custody account; or b) on-balance sheet at ring-fenced operating entities or above the bail-in level.
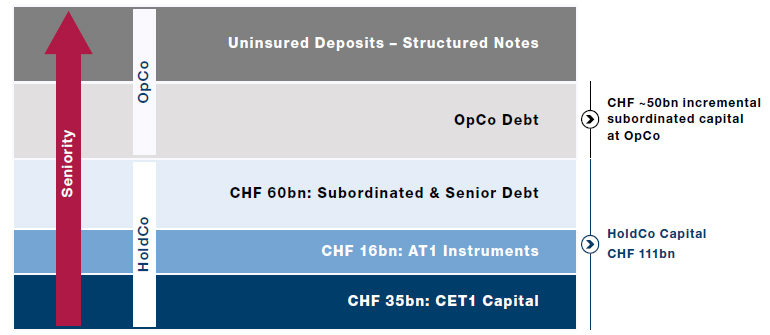
At CS, for instance, CRS investor funds reside at CSAG, the primary operating entity “OpCo” – not CSGAG, the bank holding company “HoldCo” (Figure 3). This is a critical point, as the liabilities at the HoldCo are structurally subordinated to OpCo. Therefore, in a bank resolution, HoldCo debt is impaired first. This structural subordination is why OpCo debt typically has a 2-3 notch credit rating uplift versus HoldCo debt. CSAG, as of the end of last year, had CHF160 billion of loss-bearing capital (equity and non-structured debt) on CHF130 billion of assets adjusted for the Swiss mortgage loan book (CHF100 billion), cash (CHF70 billion) and liquid fixed-income securities (CHF100 billion), which would be expected to trade at or near balance-sheet value.11 CSGAG, on the other hand, had CHF100 billion of total capital, essentially all of which was down streamed to CSAG in return for equity and notes.12 Shareholders and junior subordinated creditors of CSGAG therefore lost money when the bank was sold for CHF3 billion.
Figure 3. CS Structure

Source: Man GPM based on Credit Suisse financial statements; as of 31 December 2022.
Another feature of CRS securities allows for incremental protection: CRS securities without cash backing lose their risk-weighted asset mitigating benefits.
When proceeds are placed in an off-balance sheet custody account, investors benefit from incremental legal protections and funds being invested in short-term sovereign debt. While we acknowledge the incremental protections such a structure affords, there is an implicit opportunity cost equivalent to that of bank funding spreads.
The forced sale of CS could reasonably be assumed to have come close, but not all the way toward full receivership or even liquidation. The figures above related to CSAG loss-bearing capital imply that even the latter would not have impacted CRS security collateral due to structural seniority. However, another feature of CRS securities allows for incremental protection: CRS securities without cash backing lose their risk-weighted asset (‘RWA’) mitigating benefits. If a resolution authority were to decide to liquidate reference collateral, CRS owners could rightly question if such a sale was in their best interests as the documents governing the deals demand. And if CRS cash collateral was written off or otherwise reduced, the inherent RWA mitigation would reverse, pushing down the bank’s capitalisation ratios. Importantly, resolution authorities are typically charged with maintaining sufficient capitalisation even in receivership.
Considered from a different angle, a write down of the cash backing a CRS could reasonably be assumed to lead the national resolution authority to replace that capital with taxpayer funds. Such scenarios are not hypothetical: the Bank of Portugal (‘BdP’) struggled with just such an issue following its resolution of Banco Espirito Santo (‘BES’) in 2014. Ultimately, while equity, subordinated debt and some senior debt were written completely down or permanently impaired, the CRS securities issued by BES remained in force with no impairment.13 Had the BdP impaired collateral, it would have been forced by the European Central Bank to replace the impaired collateral with taxpayer funds in order to maintain Tier 1 capital.
Conclusion
We expect to see extremely strong underwriting conditions for the rest of 2023.
When we first wrote about CRS for Man Institute last year, we argued that these securities can benefit both parties involved: “Sellers (banks) can substantially improve allocated capital efficiency and increase asset velocity while retaining important client relationships and their attendant fee income streams. Buyers (investors), meanwhile, can receive low-beta, high-quality, and predictable cash flows tied to contractual obligations not otherwise available or replicable in the capital markets.”
The turmoil in the banking sector this month has been incredible but, as we said originally, we continue to view CRS as a credible solution for meeting banks’ and investors’ needs. Recent events have only reinforced our conviction. Disruptive as this crisis has been in many ways, we consider the resulting dynamics highly supportive of the demand for and structure of CRS transactions and we expect to see extremely strong underwriting conditions for the rest of 2023.
1. Source: Man GPM analysis; as of 27 March 2023.
2. Source: European Central Bank; as of 27 March 2023.
3. Source: Man GPM; as of 27 March 2023.
4. Source: Man GPM; as of 27 March 2023.
5. Source: Bloomberg; as of 27 March 2023.
6. Source: Man GPM; as of 27 March 2023.
7. Source: Man GPM; as of 27 March 2023.
8. Source: Man GPM; as of 27 March 2023.
9. Source: Bloomberg; as of 27 March 2023.
10. Source: Man GPM; as of 27 March 2023.
11. Source: Man GPM; as of 27 March 2023.
12. Source: Man GPM; as of 27 March 2023.
13. Source: Man GPM; as of 27 March 2023.
You are now leaving Man Group’s website
You are leaving Man Group’s website and entering a third-party website that is not controlled, maintained, or monitored by Man Group. Man Group is not responsible for the content or availability of the third-party website. By leaving Man Group’s website, you will be subject to the third-party website’s terms, policies and/or notices, including those related to privacy and security, as applicable.