Executive summary
With a spate of national and intergovernmental carbon markets, and a decentralised, heterogeneous voluntary market, some investors are unsure how to navigate the complexity. Which, if any of these markets, are stable, robust and well-operated? And as with any new asset class, many investors wonder if it is safe to enter these markets, or if they still need to mature.
In this paper, we seek to answer these questions through developing a risk assessment framework, consisting of qualitative and quantitative checks that encompass the financial, structural/regulatory and reputational risks of participating in these markets, and we use a traffic light system to rate the risk in each category. We examine the major European and North American compliance carbon markets, all of which operate as cap-and-trade systems, and then study the voluntary carbon market, before considering some alternative ways to wade into carbon trading. Drawing all of this together, we summarise our perspective on carbon markets as an investment opportunity for institutions.
1. Introduction
Investing in carbon markets: a financial and environmental win?
In the past two decades, market participants have begun to price and trade “carbon credits” in both regulatory and voluntary markets.
To translate the physical reality of climate change to an economic reality, a price must be assigned to the greenhouse gas emissions that drive global warming. In the past two decades, market participants have begun to price and trade “carbon credits” in both regulatory and voluntary markets. On the regulatory side, governments around the world have launched compliance markets to enforce emissions caps on various sectors and let demand set the price for greenhouse gas emissions (GHGs)1. Beyond these emissions trading systems, the world has also seen surging demand for carbon credits to offset GHGs, especially from corporations which have made net zero emissions pledges and which may or may not be in-scope for regulatory markets. In this voluntary carbon market (VCM), investors purchase credits from projects that draw down atmospheric carbon dioxide and then “retire” those credits to offset emissions from their own activities, improving their carbon balance sheets. The carbon credits (both emission allowances and offsets) traded in these markets are gaining attention from investors as a new asset class in a growing market, with the prospect of increasing value.
Compliance markets create a financial incentive to reduce greenhouse gas emissions and invest in alternative technologies by establishing a carbon price. The markets generally function as “cap-and-trade” systems, as follows. The regulator defines the scope of the market, typically consisting of high-emitting sectors, and sometimes covering a broad range of industrial activities. The regulator determines a cap on the total GHG emissions for each sector, setting the total number of emission allowances in the system. An emission allowance is a permit for the legal right to emit a ton of carbon dioxide (or CO2eq when covering other GHGs, standardised in terms of the radiative effect of carbon dioxide). Typically, the regulator allocates some emission allowances to each entity for free. Then, regulated entities bid in an auction for the right to emit at levels above the free allocation. Market participants can also sell their surplus allowances, reaping a reward for cutting emissions. These allowances are transacted at auction, where participants submit bids for a desired quantity of emission allowances, and those bids are collected and ranked in decreasing price order. The price point at which the bid volume matches the auction volume is the auction clearing price, which all successful bidders pay.
There is reason to believe that the carbon price will increase over time as net zero commitments proliferate and lowercost decarbonisation strategies are exhausted.
There is reason to believe that the carbon price will increase over time as net zero commitments proliferate and lower-cost decarbonisation strategies are exhausted. The policymakers that regulate compliance markets are solving for higher carbon prices to achieve their emissions targets; the level of commitment and ambition varies across markets, which we discuss further in Section 2 of this paper. Therefore, the markets are structured to have a decreasing supply of credits, forcing regulated industries to progressively reduce their emissions. This scarcity encourages increasing auction prices going forward. Further, in some markets the scope of regulated sectors will expand, broadening the range of activities that must be decarbonised and increasing the demand for green energy and technologies across the economy.
To better understand what drives the carbon price, a marginal abatement cost curve (MACC) illustrates the expense of decarbonising a given activity (Figure 1). The options for reducing emissions can be stacked in order of increasing price along the x-axis. The potential emissions reduction that can be achieved by each option is indicated by the height of the bar on the y-axis. The initial options on the left-hand side, like energy efficiency measures, might even save money. As decarbonisation progresses, cheaper options are exhausted, and the marginal abatement costs facing entities increases. The price of an emission allowance should correspondingly increase with time. We believe this makes a long-term investment in carbon an appealing prospect. A MACC is not static, however: future technological breakthroughs could provide low-cost mitigation options with large abatement potential, reducing carbon prices.
Figure 1. An illustrative marginal abatement cost curve
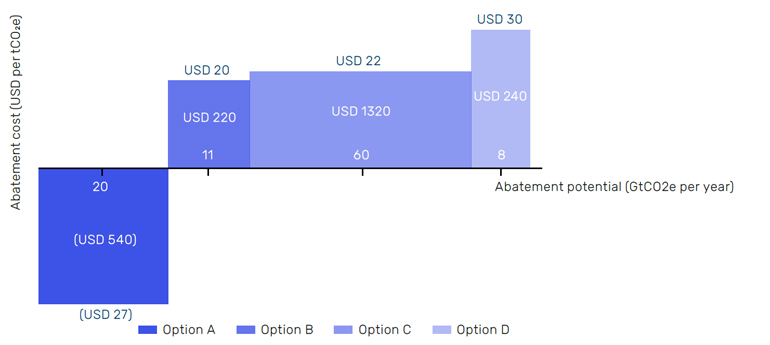
Source: CEEW-CEF analysis. Available here: https://www.ceew.in/cef/quick-reads/explains/marginal-abatement-cost-curve). The options are plotted in increasing price order. The abatement potential of each option is shown on the x-axis, and the height of the bar indicates the marginal cost of abatement. The price in the center of the box indicates the total cost to fully utilise that option (the area of the box). The MACC looks different across markets depending on the policy landscape, stage of development, prominent industries, technology availability and other factors, implying different carbon prices across markets.
For responsible investors, there is also an environmental case for participating in carbon markets.
For responsible investors, there is also an environmental case for participating in carbon markets. Investing in carbon in compliance markets, even if one eventually sells the allowance, can have a positive environmental impact through at least two mechanisms2. First, when investors participate in auctions it increases demand and supports a higher carbon price, making lower-carbon technologies viable. In other words, it contributes to a market’s progress along a MAC curve.
The second mechanism is specific to the European Union (EU), though similar processes may occur in other compliance markets. When investors without regulatory obligations hold allowances, those allowances cannot be used towards emissions within the regulated market, causing in-scope emissions to drop faster than the allowance supply. In the EU Emissions Trading Scheme (ETS), that triggers the Market Stability Reserve (MSR) to automatically withdraw allowances from the subsequent auction pool, as long as the surplus is above a threshold. The impact builds over the duration of the investment, as the allowances continue to contribute to the market surplus and thus the triggering of the MSR mechanism. This impact on the allowance supply and emissions is not reversed when the investor eventually sells the allowance. On the voluntary side, the VCM serves as a channel for climate finance, especially to developing nations. It provides an opportunity to fund carbon avoidance or removal projects based on methods such as improved forest management, mangrove forest restoration, renewable energy developments or community projects that introduce energy efficient, clean alternatives to burning coal and wood, for example. Beyond their impact on atmospheric greenhouse gas concentrations, carbon offset projects can carry a variety of high-impact local co-benefits, like boosting employment for project management and monitoring, bolstering ecosystem health and biodiversity through nature-based solutions, and improving indoor or outdoor air quality.
Weighing the risks
Carbon markets are quirky and complicated when compared to many traditional assets.
This all sounds compelling — but carbon markets are quirky and complicated when compared to many traditional assets. With a spate of national and intergovernmental carbon markets, and a decentralised, heterogeneous voluntary market, some investors are unsure how to navigate the complexity. Which, if any of these markets, are stable, robust and well-operated? And as with any new asset class, many investors wonder if it is safe to enter these markets, or if they still need to mature. In this section, we investigate this investment arena more deeply and consider whether carbon allowances and credits are an appealing asset class for an institutional investor.
We develop a risk assessment framework for institutional investors to guide our study (Table 1) which consists of a set of qualitative and quantitative checks that encompass the financial, structural/regulatory and reputational risks of participating in these markets. Specifically, we seek to address questions, including how does price discovery occur in this market? Are there any weaknesses or concerns relating to how the price is set, or how buyers and sellers interact? Is the market structurally stable, or is there a risk of political or regulatory disruptions? And for the market depth check: what does demand look like in this market? To what extent does the auction frequency limit liquidity? After investigating these questions, we use a traffic light system to rate the risk in each category: green indicates low risk, yellow indicates some cause for concern, and red indicates higher risk that warrants serious consideration. Where pertinent, we consider what changes to the market would alter a negative verdict. What improvements should astute investors look out for in the coming years?
In this paper, first we investigate the major European and North American compliance carbon markets, all of which operate as cap-and-trade systems. Next, in Section 3, we discuss the ratings of the voluntary carbon market and in Section 4 we consider some alternative ways to wade into carbon trading. Finally, we summarise our perspective on carbon markets as an investment opportunity for institutions.
2. Compliance Carbon Markets
These markets all have high reporting requirements and ample public data availability.
We focus here on four well-established carbon markets that allow non-regulated entities to participate - a green light for market access in the risk matrix (Table 1). Those markets are: the European Union Emissions Trading Scheme (EU ETS, established in 2005), the California cap-and-trade system (launched in 2012 and linked with Quebec since 2014), the Regional Greenhouse Gas Initiative (RGGI, established in 2009), and the United Kingdom ETS (launched in 2021 to replace the pre-Brexit UK participation in the EU ETS). These markets all have high reporting requirements and ample public data availability, including auction reports, allocation plans, and lists of registered participants. Participating in compliance carbon markets is unlikely to cause reputational damage due to scientific integrity issues (another green light in the matrix). Emission allowances are standardised and uniform, so there is no ambiguity about the merit of the asset. As we will cover later, that is not the case for carbon offsets in the voluntary market, where the scientific integrity of credits varies substantially.
Table 1. Risk assessment matrix for an institutional investor
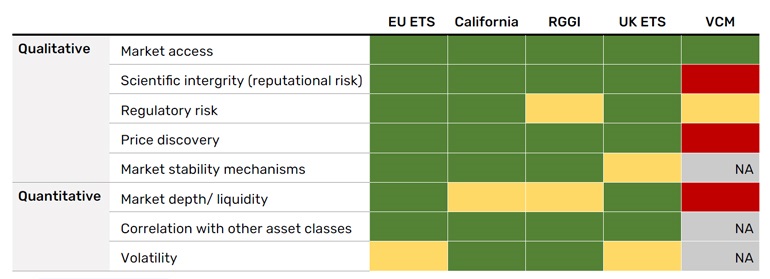
Source: Man Group, as of October 2023. Green indicates low risk, yellow indicates some cause for concern, and red indicates higher risk. The carbon markets are listed in the top row: The European Union Emissions Trading System (EU ETS), the California-Quebec cap-and-trade system, the Regional Greenhouse Gas Initiative (RGGI), the United Kingdom Emissions Trading System (UK ETS), and the Voluntary Carbon Market (VCM).
These four markets are a small sample of existing markets, and one can make a systematic assessment of any carbon market using the risk assessment framework. For example, the China ETS, established in 2021, is poised to become a major global market given the scale of China’s economy and its greenhouse gas emissions, but it is not yet a viable option for most investors. Currently, China’s market does not allow outside investors, there is limited data availability, market stability measures have not yet been specified, and compliance targets are limited and intensity-based, signaling hesitancy to hamper industrial production. As the China ETS matures, one can watch for updates relevant to these dimensions of the risk assessment matrix.
Market depth and liquidity
Free allocation aims to protect domestic industry and reduce carbon leakage, but as a side effect mutes the carbon price signal for the benefiting industries.
The EU ETS is the largest of the four markets we consider in terms of the total auction volume, followed by California, and then the much smaller RGGI and UK ETS (Figure 2). In addition to the auctioned allowances, all four markets issue some emission allowances to regulated entities for free, contributing to the overall emissions cap (Figure 2). Free allocation aims to protect domestic industry and reduce carbon leakage, but as a side effect mutes the carbon price signal for the benefiting industries. In 2022, the EU freely allocated 533 million tons of CO2eq3, and while some high-risk sectors will continue to receive free allowances indefinitely, for most sectors the practice will be phased out by 20304. California’s free allocation in 2022 was distributed across 216 facilities in its regulated sectors5. In RGGI, free allocation is determined by state-level initiatives, and comprised about 2.5% of the 2022 total allowance budget6. In the UK, free allocation plans are published through 2025, with each installation’s budget subject to revision if activity levels increase or decrease by over 15%7.
Figure 2. 2022 Allowance Volume
Problems loading this infographic? - Please click here
Source: EU ETS, available here: www.eex.com/en/market-data/environmentals/eu-ets-auctions; UK ETS, available here: www. ice.com/report/278; California, available here: ww2.arb.ca.gov/our-work/programs/cap-and-trade-program/auction-information/auction-notices-and-reports; and RGGI, available here: https://www.rggi.org/auctions/auction-results/prices-volumes. The bars indicate the total number of emission allowances auctioned (dark blue) and freely allocated (light blue) over the last full year, 2022. Note that for the EU, California, and the UK, one allowance corresponds to one metric ton of CO2eq, while RGGI allowances are for short tons of CO2. The free allocation for RGGI in 2022 was 2.4 million allowances.
Demand has been healthy in all four auctions over the last five years.
The EU holds auctions most frequently, at three days per week, compared to biweekly auctions in the UK, and quarterly auctions in California and RGGI. In addition to auctions, EU ETS participants with surplus allowances can trade them in a daily spot market hosted by the Intercontinental Exchange (ICE), making the EU the most liquid compliance market by far. The low frequency of auctions in California and RGGI limits liquidity, hence the yellow rating in the risk matrix. However, demand has been healthy in all four auctions over the last five years, as measured by the auction cover ratio, the ratio of bid volume to auction volume (Figure 3). The cover ratios, which have averaged above one, indicate demand outpacing supply, making for competitive auctions with few exceptions (notably California’s first auction during the Covid-19 pandemic lockdowns on 20 May 2020, with a 0.37 cover ratio). Regarding price discovery, no flags were raised for any of the four markets. Prices are determined by bids in the regularly scheduled auctions, and for all four markets price discovery is enhanced via secondary markets, with futures and options traded daily on exchanges (discussed further in Section 4).
Figure 3. Cover ratio at each auction across the four markets since 2018
Problems loading this infographic? - Please click here
Source: Bloomberg. A cover ratio below one indicates an oversupply of allowances, while a ratio above two indicates strong demand, with the bid volume double the available auction volume, as of 18 October 2023.
Regulatory features, price history, and volatility
The carbon price varies considerably across the world’s compliance markets Demand has been healthy in all four auctions over the last five years.
When considering the carbon price at auctions since 2018, two features stand out: first, the substantial disparities in the carbon price between the markets, and second, the long-term increase in the price in the EU ETS, California, and RGGI (Figure 4). Numerous factors contribute to the price disparities, including different sectoral scopes, price control measures, and regulatory ambition levels. Each of these factors shapes the relevant MACC (Figure 1), and further, the different markets and sectors stand at different points in the decarbonisation process. Thus, the carbon price varies considerably across the world’s compliance markets. The annualised returns over a five-year period since 2018 are very attractive for the EU (33%), California (19%), and RGGI (25%), while the annualised return is negative over the short history of the UK ETS (-5%) (Table 2). The scope and regulatory features of the markets will be described in the rest of this section. This information is also summarised in the risk matrix in the Appendix.
Figure 4. Auction clearing price since 2018
Problems loading this infographic? - Please click here
Source: Bloomberg. The auction clearing price history since 2018, with currency units converted to USD using historical currency conversion rates, and short tons converted to metric tons for RGGI. As of 2 October 2023.
As the world’s first compliance carbon market, launched in 2005, the EU ETS continues to stand out alongside California as a leader in terms of regulatory consistency and ambition.
As the world’s first compliance carbon market, launched in 2005, the EU ETS continues to stand out alongside California as a leader in terms of regulatory consistency and ambition. The EU ETS has benefited from a long development period: in its initial two phases, the EU carbon price was volatile and often low, dipping to zero in 2007 due to an enormous surplus of allowances. The allowance volumes at that point were based on poor estimates of emissions since reliable data was not yet widely available. Following the 2008 Global Financial Crisis (GFC), emissions dropped substantially, leading to an allowance surplus that suppressed prices to around 15 euros per ton until 2012. Following this learning period, regulators reformed the market for Phase III (2013-2020), setting a system-wide cap, reducing the free allocation, improving market stability mechanisms and achieving higher carbon prices. The EU’s European Climate Law, a legally binding commitment to achieve net zero emissions by 2050, came into force in 2021, giving investors confidence in the EU’s long-term decarbonisation trajectory. The EU ETS covers industry, power, and domestic aviation sectors; the aviation sector is treated separately and has its own emissions cap. The European Commission (EC) steers the ETS regulation and set the phase four (2021- 2030) emissions cap to decrease by 2.2% of the 2021 volume per year. To address the surplus of allowances that built up from 2009 to 2019, which threatened to undermine proper market functioning and an effective carbon price signal, the EC established the Market Stability Reserve8. This enables adjustments to the auction supply, giving the ETS more flexibility to respond to shocks. There has been some discussion of the potential negative impact of financial actors on the EU ETS, chiefly the concern that buy-and-hold strategies could squeeze the market. Given the benefits of broader investor participation for liquidity and price discovery, it seems unlikely that investors would ever be excluded from the market. Instead, any future undesired impacts of financial operators on the ETS would more likely lead to additional market stability mechanisms, position limits, or the establishment of an independent market authority9.
California’s cap-andtrade system, on the other hand, covers an estimated 80% of the state’s emissions.
California’s cap-and-trade system, on the other hand, covers an estimated 80% of the state’s emissions across power, industry, transport, and buildings sectors, and has expanded over time to include Quebec, and soon will incorporate the state of Washington10. Each year California increases the carbon price floor by 5% plus inflation (currently 22.21 USD per metric ton) and reduces the annual cap by about 4% per year, effectively supporting an increasing carbon price to reduce greenhouse gas emissions11 (Figure 4). They also have a tiered Cost Containment Reserve (CCR) to mitigate price spikes. To provide additional flexibility and cost containment, California operates a carbon offset system, and allows participants to meet up to 4% of their compliance obligations with California carbon offsets (6% for 2026-2030). At least half of the offset usage limit for a compliance entity must be from projects that provide direct environmental benefits to the state of California. Offset-generating projects that reduce or sequester greenhouse gases are approved by the California Air Resources Board (CARB) based on six compliance offset protocols: livestock, mine methane capture, ozone depleting substances, rice cultivation, US forests and urban forests. Buyers are liable for any risks that these credits are invalidated for environmental integrity or regulatory issues.
In RGGI, which is limited to the power sector across 12 US member states, the auction cap decreased by 2.5% per year from 2015 to 2020 and will continue to decline at a rate of 3% per year for the 2021 to 2030 period. While this rate of decline is comparable to other compliance markets, emissions have often been lower than the total emissions cap12, resulting in a surplus of allowances. In 2021 the cap for the five-year period through 2025 was adjusted to account for banked allowances which had softened the impact of RGGI12. As far as market stability mechanisms, RGGI has a CCR to limit price spikes by increasing auction sales if the clearing price is above the CCR Trigger Price. The CCR size is 10% of the annual emissions cap, and the CCR Trigger Price is 14.88 USD per short ton in 2023 and scheduled to increase 7% per year through 203013. On the flip side, the Emissions Containment Reserve (ECR) reduces the allowance supply if the auction price dips below the ECR Trigger price (6.87 USD in 2023 and increasing 7% per year). Between the modest carbon price and recent state-level political controversies14,15 there is some concern regarding regulatory risk in RGGI, earning it a yellow rating in the matrix (Table 1).
In its first two operational years, the UK carbon price has dropped far below the EU ETS allowance price.
The UK market was launched in 2021 to replace the UK’s previous participation in the EU ETS, prior to Brexit. Similar to the other compliance markets, the UK ETS Authority has implemented an Auction Reserve Price (price floor, currently 22 GBP per metric ton) and Cost Containment Mechanism, which is triggered by persistent (3-month average) price levels above specified thresholds16. The emissions cap was initially determined to be 5% of the UK’s expected share of the EU ETS Phase 4 cap for 2021-2030, with 2.5% reductions annually. Though the UK government has demonstrated less commitment to climate policies than the European Commission, in 2023 it revised the allowance plan, and a more stringent net zero consistent cap will apply from 2024 onward. The UK Authority will smooth that transition by bringing reserve allowances to auction from 2024 to 202717. In its first two operational years, the UK carbon price has dropped far below the EU ETS allowance price (Figure 4). Analysts attribute the price decline to weak energy demand and reduced manufacturing in the UK, with insufficient adjustments to the carbon allowance supply18. Given the price instability over the short history of the market and negative annualised returns since its inception (Table 2), we give the UK ETS a yellow rating in the market stability mechanisms dimension of the risk matrix. Investors might wait and see over the next few years how the more ambitious allowance limits impact prices.
Over the past five years, the annualised volatility of returns for the US carbon markets is comparable to that of the S&P 500 Index.
Over the past five years, the annualised volatility of returns for the US carbon markets is comparable to that of the S&P 500 Index (22%), at 16% for California and 21% for RGGI; note that for both markets there are only four trading days (auctions) per year (Table 2). The EU ETS annualised volatility since 2018 is substantially higher at 44%. While the EU spot market, which trades daily, provides additional liquidity, it exhibits the same volatility as the auction (44% for phase 4 since 2021), as does the SparkChange physically backed EU carbon ETC (47%, since November 2021). For additional context, across the EU auctions in 2022, the clearing price ranged from approximately 62 to 111 USD per metric ton. The UK ETS, which launched in 2021, has the highest annualised volatility of the auctions considered here, at 49%. The clearing price range in the 25 auctions held in 2022 was from 75 to 111 USD per metric ton, and the price hit a low of 43 USD per ton in September 2023. As mentioned above, the plummeting price was impacted by low energy demand and ineffective market stability mechanisms.
Given these results, we rate the UK and EU as yellow in the risk assessment matrix volatility dimension. We do not consider these volatility levels a red flag because of the tradeoff of increased auction frequency in these markets, the presence of market stability mechanisms in both markets, significant annualised returns in the EU19 (33% annualised returns since 2018; Table 2), and upcoming cap tightening in the UK. In the EU, the historic price trajectory demonstrates high long-term returns, and the strong, legally binding EU climate regulations lend confidence to projections of continued future returns in this market.
Table 2. Annualised volatility
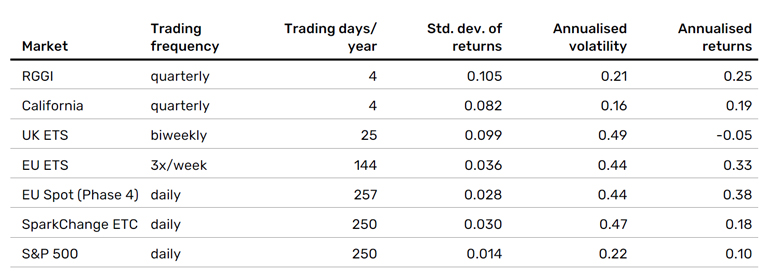
Source: Bloomberg. Based on the standard deviation (std. dev.) of returns from 2018 (where available) to October 2023 and each market’s respective trading/auction frequency. Annualised returns are calculated in the standard way. The differences between EU ETS, EU Spot, and SparkChange are due to the different time periods they cover.
Diversification benefits
There is potential benefit in investing across carbon markets.
There is potential benefit in investing across carbon markets. We look at return correlations across the compliance markets; correlations between two markets are calculated by sampling a given market price history at the less-frequent market’s frequency. The American markets are correlated with each other (correlation coefficient (r)=0.56, statistical significance (p-value)<0.01), as are the UK and EU markets (r=0.7, p<0.001). But investing in both the California cap-and-trade system and the EU ETS, for example, can provide uncorrelated return opportunities (r=0.15, not statistically significant).
Further, an investment in carbon allowances can bolster the diversification of a multi-asset portfolio. Between most markets and asset classes, return correlations are low and statistically insignificant (p>0.05) since 2018 (Table 3), signaling low risk along this dimension of the risk assessment framework (Table 1). Even for statistically significant return correlations between the EU ETS and other asset classes (the S&P 500, the MSCI Emerging Markets Index, the EURO STOXX 50 Index, and the S&P Global Oil Index), carbon allowances still provide diversification value with correlation coefficients below 0.4 (p<0.001).
Table 3. Pearson correlation coefficients for returns
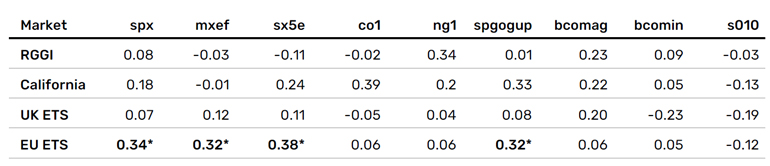
Source: Bloomberg. Covers the compliance carbon markets and various asset classes from 2018 to October 2023: the S&P 500 (spx), the MSCI Emerging Market Index (MXEF), the EURO STOXX 50 (sx5e), the generic first oil future (co1:com), the generic first natural gas future (ng1:com), the S&P Global Oil Index (spgogup), the Bloomberg agriculture commodities subindex (bcomag), the Bloomberg industrial metals subindex (bcomin), and the ICE BofA 10 Year US Treasury Constant Maturity STRIPS Index (s010). The s010 index is the US 10-year bond daily total return price level, so that US 10-year bonds can be treated as a single asset. For each auction, the index/commodity price time series is sampled at the dates nearest to auction dates, and then returns are calculated at that sampling frequency. Values in bold with an asterisk are statistically significant (p<0.001), while all other values are not statistically significant (p>0.05).
3. The Voluntary Carbon Market (VCM)
As it stands the VCM, a market valued at $2 billion, is fragmented, unstandardised, and largely unregulated.
The VCM refers to all the trading of carbon offsets outside the mandate of government cap-and-trade schemes. As it stands the VCM, a market valued at $2 billion, is fragmented, unstandardised, and largely unregulated20. It had been plagued by scandals over the quality of some credit-issuing carbon mitigation projects, making it clear that all carbon offsets are not created equal. That being said, the VCM is necessary, as it will be impossible for many entities to achieve total carbon abatement in the short term, requiring them to offset some emissions to hit their net zero goals. There is no consensus about the degree to which companies should rely on offsetting to reach net zero targets, only that the primary strategy needs to be decarbonising operations to the fullest extent possible. In light of the urgent need to neutralise residual emissions, this space is rapidly evolving; the Taskforce for Scaling the Voluntary Carbon Market projects that the VCM will be a $50 billion market by 2030. Several standard-setting organisations are stepping up, aiming to improve the market functioning and to ensure that emissions offsets are credible and validated. On the demand side there is the Voluntary Carbon Markets Initiative (VCMI), and on the supply side, the Integrity Council for the Voluntary Carbon Market (ICVCM). Then there are the agencies that rate, register, and track credits; some of the leaders in this arena are Verra, Gold Standard, Climate Action Reserve, and American Carbon Registry. To procure high-quality carbon offsets, those are the places to look. But for an institutional investor looking at carbon offsets as an asset class, what’s the guidance?
The VCM is not yet institutional grade, but is an exciting arena to monitor as it scales and matures.
Based on the risk assessment matrix, the VCM is not yet institutional grade, but is an exciting arena to monitor as it scales and matures. Three dimensions stand out as “red lights” in the risk matrix: scientific integrity (associated with the lack of offset standardisation), price discovery, and liquidity. We rate one more category as yellow: regulatory risk. And for three categories we did not provide a rating: there are no centralised market stability mechanisms in place, and there was insufficient data to address the correlation with other asset classes or volatility for the market as a whole.
We believe the most glaring problem with the VCM is the glut of dubious credits in circulation.
We believe the most glaring problem with the VCM is the glut of dubious credits in circulation. When assessing the scientific integrity of carbon offsets, there are four key factors to consider. First, how permanent is the greenhouse gas abatement provided by the underlying project? Is the carbon dioxide sequestered in calcium carbonate, locked away on geologic timescales? Or, is the carbon dioxide drawn down by trees in a forest with high wildfire risk? Some registries like Climate Action Reserve require project monitoring to ensure permanence, particularly for nature-based projects like forest or soil management. The second consideration is additionality: would the project have taken place without the crediting revenue, due to pre-existing regulatory or financial incentives? This is a crucial check for ensuring that credits represent genuine, additional mitigation efforts. In Australia’s carbon market this has been a particular pain point. Australia has a compliance market, but outsiders can also buy Australian offsets, called Australian Carbon Credit Units (ACCUs), on a voluntary basis. Many of the credits have come under scrutiny for their lack of additionality, particularly from landfill gas methane abatement projects and humaninduced regeneration (HIR) forestry projects21,22. This leads to serious reputational risks for organisations relying on these carbon offsets to meet their emissions targets23,24,25. The third key consideration when assessing scientific integrity is leakage. Leakage is a problem when demand for commodities will lead to compensatory activity (e.g. logging/farming) elsewhere, so a project effectively relocates emissions rather than providing genuine abatement. The fourth scientific integrity consideration is double counting. The VCM needs to ensure via registries that an appropriate number of credits is issued and that each credit is retired once. Credits lose their meaning if they are counted numerous times, for example towards a country’s nationally determined contribution accounting and again towards a foreign company’s net zero targets.
Between opaque pricing, liquidity limitations, and the reputational risks of navigating the vast range of project types, the VCM is not yet institutional grade.
The VCM’s second high-risk rating is for price discovery. There is no single centralised exchange for voluntary offsets. Rather, they are traded on a number of exchanges as well as over the counter, and price disparities are vast. Generally, the more accessible credits traded on exchanges with efficient price discovery are more likely to be cheap credits with scientific integrity issues. For higher quality credits purchased over the counter, it can be difficult to discern what constitutes a fair price. This leads to the third high-risk rating in the matrix, in the market depth/liquidity category, since the high-quality offsets trade over the counter. Between opaque pricing, liquidity limitations, and the reputational risks of navigating the vast range of project types, the VCM is not yet institutional grade. But for entities willing to do their due diligence on project quality, the VCM is a powerful way to fund high-impact, nature-restoring efforts, especially in emerging markets.
4. Other ways to participate
For investors who want to test the waters of carbon trading but avoid the byzantine elements, there are a few more accessible options.
For investors who want to test the waters of carbon trading but avoid the byzantine elements, there are a few more accessible options. First, one can trade EU allowances daily in the spot market on the European Energy Exchange (EEX), though this does require registration with the European Commission. Another option is exchange-traded carbon, like the SparkChange EUA ETC, a financial instrument that allows investors to trade credits that are physically backed with EU ETS allowances, without the need for auction registration and bidding. Alternatively, investors can access derivatives for the various compliance markets on typical trading platforms. One straightforward way to invest in carbon futures is through the KraneShares Global Carbon Strategy ETF, which tracks futures contracts for the EU, California, RGGI, and UK cap-and-trade programs. One can also trade these contracts directly. From a pricing perspective, futures contracts are a good proxy for the underlying emissions auction prices. On average since 2018, the EU futures have traded at a premium of 0.5%, and have generally been within 5% of fair value (Figure 5). The UK futures, which have been trading since 2021, have averaged a 2.7% premium and are generally above fair value. While trading futures and options has little direct benefit or impact from an environmental perspective, it does facilitate price discovery as well as risk-sharing. These instruments allow investors to access some of the financial opportunity associated with carbon with a similar price pattern.
Figure 5. Price Difference (Generic Futures Price – Auction Price)
Problems loading this infographic? - Please click here
Source: Bloomberg. The percent difference of the generic futures price from the auction clearing prices for EU and UK emission allowances at each auction date. Futures and auction prices are first converted to USD. As of 18 October 2023.
5. Conclusions
Overall, after applying the risk assessment framework, emission allowances in the California cap-and-trade system and the EU ETS emerge as particularly attractive investment opportunities in our view. The EU ETS and California are the largest markets in terms of allowance volume, and both are set to continue expanding in scope. Both markets have seen increasing auction prices over the historical period producing what we consider strong annualised returns, and both are relatively strong from a policy perspective, in our view, which gives confidence in continued carbon allowance price increases as they progress towards decarbonisation targets. From an investment risk perspective, we believe the greatest concern for the EU carbon market is its high annualised volatility, and for the California market is liquidity, given the quarterly auction frequency. Given their uncorrelated returns, investors might benefit from participating in both markets, and would diversify their broader portfolios by doing so (Table 3). RGGI and the UK ETS are also relatively robust markets, with somewhat higher risk profiles than the EU and California. In particular, the UK is in its first phase until 2025, and will begin to apply stricter emissions caps this year. Investors might revisit this market and consider its price evolution over the next few years before deciding to participate. Compliance markets more generally are a space to watch, as there are dozens of markets at various stages of maturity around the world. On the voluntary side, the VCM does not yet have sufficient safeguards in place to attract institutional investors. However, the VCM will play a critical role in the path to net zero emissions, and with recent integrity initiatives on the supply and demand sides, the risk assessment might soon be more favourable.
References
1. “Carbon Pricing Dashboard” (Last updated March 31, 2023) The World Bank. Retrieved from www.carbonpricingdashboard.worldbank.org/map_data
2. Ruf and Schroeter (2022) “The Impact of Carbon Investing.” SparkChange. The-Impactof- Carbon-Investing.pdf (sparkchange.io)
3. “EU member states have used 52% of free 2023 ETS allowances: EC” (March 8, 2023) S&P Global. Retrieved from www.spglobal.com/commodityinsights/en/marketinsights/latest-news/electric-power/030823-eu-member-states-have-used-52-offree-2023-ets-allowances-ec
4. “Allocation to industrial installations” European Commission. Retrieved from www.climate.ec.europa.eu/eu-action/eu-emissions-trading-system-eu-ets/free-allocation/ allocation-industrial-installations_en
5. “Cap-and-Trade Program Vintage 2022 Allocation Summary.” (2021) The California Air Resources Board. Retrieved from ww2.arb.ca.gov/sites/default/files/2021-12/ncv2022%20Public%20Allocation%20Summary.pdf
6. “The Regional Greenhouse Gas Initiative: RGGI Allowance Distribution.” (2023) RGGI. Retrieved from www.rggi.org/allowance-tracking/allowance-distribution
7. “Report on the Functioning of the UK Carbon Market for 2021 and 2022” (July 2023) UK Gov. Retrieved from assets.publishing.service.gov.uk/government/uploads/system/uploads/attachment_data/file/1174408/functioning-of-the-uk-carbon-market.pdf
8. “Market Stability Reserve” European Commission. Retrieved from climate.ec.europa.eu/eu-action/eu-emissions-trading-system-eu-ets/market-stabilityreserve_en
9. Cludius et al. (Dec. 2022) “The role of financial operators in the ETS market and the incidence of their activities in determining the allowances’ price” European Parliament– Policy Department for Economic, Scientific and Quality of Life Policies. www.europarl.europa.eu/RegData/etudes/STUD/2022/740052/IPOL_STU(2022)740052_EN.pdf
10. CARB ww2.arb.ca.gov/our-work/programs/cap-and-trade-program/about
11. “USA- California Cap-and-Trade Program” ICAP. Retrieved from icapcarbonaction.com/en/ets/usa-california-cap-and-trade-program
12. “RGGI announces downward cap adjustment for 2021-2025” (March 18, 2021) ICAP. Retrieved from icapcarbonaction.com/en/news/rggi-announces-downwardcap-adjustment-2021-2025
13. “USA - Regional Greenhouse Gas Initiative (RGGI)” ICAP. Retrieved from icapcarbonaction.com/en/ets/usa-regional-greenhouse-gas-initiative-rggi
14. “Virginia prepares regulation to repeal ETS and withdraw from RGGI” (June 14, 2023) ICAP. Retrieved from icapcarbonaction.com/en/news/virginia-preparesregulation-repeal-ets-and-withdraw-rggi
15. Huangpu (Nov. 1, 2023) “Pa. court strikes down a key climate program, but environmentalists expect an appeal” Spotlight PA www.spotlightpa.org/news/2023/11/regional-greenhouse-gas-rggi-struck-down-pennsylvania-climatechange-fossil-energy/
16. “UK Emissions Trading Scheme markets” (Sep 2023) UK Gov. Retrieved from www.gov.uk/government/publications/uk-emissions-trading-scheme-markets/uk-emissions-trading-scheme-markets#:~:text=The%20cap%20sets%20the%20limit,set%20out%20in%20the%20legislation
17. “Developing the UK Emissions Trading Scheme: Main Response” (June 2023) UK Gov. Retrieved from assets.publishing.service.gov.uk/government/uploads/system/uploads/attachment_data/file/1166812/uk-emissions-trading-scheme-consultationgovernment-response.pdf
18. Gupte and Edwardes-Evans (May 31 2023) “UK carbon prices dive to multi-year lows, EU ETS disconnect widens” S&P Global www.spglobal.com/commodityinsights/en/market-insights/latest-news/energy-transition/053123-uk-carbon-prices-dive-tomulti-year-lows-eu-ets-disconnect-widens
19. Azlen et al. (2022) “Carbon as an Emerging Asset Class.” The CFA Institute. rpc.cfainstitute.org/en/research/reports/case-study-carbon-as-emerging-asset-class
20. Citi Global Perspectives & Solutions (July 2023) “Voluntary Carbon Market: A Critical Piece of the Net Zero Puzzle” Citi Group. www.citigroup.com/global/insights/citigps/voluntary-carbon-market
21. MacIntosh et al. (2022) “Measurement Error in the Emissions Reduction Fund's Humaninduced Regeneration (HIR) Method” The Australian National University, Canberra. law.anu.edu.au/sites/all/files/measurement_error_in_hir_method_14_march_2022.pdf
22. MacIntosh, A. (2022) The Emissions Reduction Fund's Landfill Gas Method: An Assessment of its Integrity. The Australian National University, Canberra. law.anu.edu.au/sites/all/files/erf_landfill_gas_method_-_an_assessment_of_its_integrity_16_march_2022.pdf
23. Morton (September 21, 2021) “One in five carbon credits under Australia’s main climate policy are ‘junk’ cuts, research finds” The Guardian. www.theguardian.com/environment/2021/sep/22/one-in-five-carbon-credits-under-australias-main-climatepolicy-are-junk-cuts-research-finds
24. Morton (March 23, 2022) “Australia’s carbon credit scheme ‘largely a sham’, says whistleblower who tried to rein it in” The Guardian. www.theguardian.com/environment/2022/mar/23/australias-carbon-credit-scheme-largely-a-sham-sayswhistleblower-who-tried-to-rein-it-in
25. Holder (Jan 17, 2023) “Many Companies Are Shying Away From Carbon Credits” The Wall Street Journal. www.wsj.com/articles/many-companies-are-shying-away-fromcarbon-credits-11673900838
You are now leaving Man Group’s website
You are leaving Man Group’s website and entering a third-party website that is not controlled, maintained, or monitored by Man Group. Man Group is not responsible for the content or availability of the third-party website. By leaving Man Group’s website, you will be subject to the third-party website’s terms, policies and/or notices, including those related to privacy and security, as applicable.