Introduction
We believe that it is possible to create a systematic framework for evaluating the effectiveness of different ESG ratings in order to better manage headline risk.
Headline risk is one of the key concerns of ESG investors. No one wants his or her portfolio to be in the spotlight due to negative ESG incidents, and the impact on returns can be quite destructive.1 But, given the seeming randomness of some incidents, is this risk unavoidable? There has been an explosion in different ESG data and ratings provided by various vendors, but many are not geared toward proactively helping investors avoid negative ESG incidents and the headline risk that comes with them. That said, we believe that it is possible to create a systematic framework for evaluating the effectiveness of different ESG ratings in order to better manage headline risk.
Effective ESG ratings should be informative in predicting future ESG-related incidents. If ESG ratings appropriately reflect the efforts that a firm makes to promote ESG (Serafeim et al., 2022)2, then firms with high ESG ratings should experience fewer ESG-related incidents in the future. But is that the case? As heavy users of ESG data, we naturally wondered how effective current ESG ratings are in predicting future incidents. In this paper, we propose an incident prediction model as a framework to evaluate ESG ratings and a solution to reduce headline risk for ESG investors.
In part I, we discuss the data sources we use to construct our ESG incident prediction model, as well as various control variables to address the potential bias in ESG rating evaluation. Part II covers the model specification for the incident prediction model and firm characteristics that lead to higher future incidents. We evaluate the effectiveness and biases of diverse ESG metrics by two mainstream providers, MSCI and Sustainalytics, in part III. In the last part, we present a comparative analysis of our proprietary incident model with third-party solutions to assess the quality of the model in terms of incident prediction accuracy.
Part I: Incident Data Feature and Descriptive Analysis
Mainstream ESG ratings often have unintended generic factor biases and region biases. For example, Sustainalytics and MSCI ESG scores have strong Barra value, quality and size exposure (Wee et al., 2022)3. Therefore, more than 60-80% of the performance of mainstream ESG ratings is driven by generic Barra factors. To better evaluate the efficacy of ESG ratings, we need to control these biases in our incident model. In this section, we will first introduce the incident data used to construct the incidentrelated variables and then go through various control variables used to account for the potential biases for ESG ratings evaluation.
Incident Data
We will examine RepRisk4, a leading third-party provider of ESG incident data. We leverage this incident data to construct our incident prediction model. The data provider we work with collects an extensive amount of data on ESG-related incidents and links them to the company level.
In terms of the data collection process, the data vendor will first screen over extensive public information sources to capture events, including both printed and online media from local to international level in multiple languages. Second, these identified incidents will be further filtered by an artificial intelligence algorithm to select only negative incidents and incidents related to ESG topics. Finally, analysts review these events to ensure that the incidents are ESG related and not a duplication of earlier incidents. Analysts also assign an incident severity score to each incident based on the severity of events.
The incident severity metric range is low, mid and high. According to the data provider, the severity measure of the incident is a function of three dimensions: a) the consequences of incidents (e.g., if the incidents are associated with death or severe injury with respect to health and safety), b) the extent of the impact (e.g., if there are a large number of people involved in the incidents), and c) the causes of incidents (e.g., if the incidents were caused by negligence, by an accident or in a systematic way). An incident with a life-threatening danger that involves many people and is caused in a systematic way would be the most serious.
The goal of the model is to forecast the probability of future ESG incident occurrence to evaluate current ESG ratings and to reduce headline risk.
We developed our incident prediction model with these incident data as one of the important inputs. The goal of the model is to forecast the probability of future ESG incident occurrence, evaluate current ESG ratings, and reduce headline risk. Since more severe incidents have a greater impact, we focus on predicting ESG incidents with mid and high severity levels. Similarly, drawing on the same raw incident data, the third-party data provider we use publishes a reputation risk index (RRI), a weighted moving average of firm incidents to measure firms’ ESG risk. RRI values range from 0 to 100, with higher numbers denoting higher ESG incident rates. In part IV, we compare our predictive model with this backward-looking data and find that our incident model demonstrates better incident forecast accuracy.
Descriptive Analysis and Control Variables to Address Evaluation Bias
In the developed market public equity universe, approximately 2,000 companies are associated with ESG incidents each year (Figure 1). There are around 1,000 companies associated with ESG incidents annually in emerging markets. For all ESG incidents, one-third of the total incidents are classified as mid-level or high-level incidents. Around 1,300 companies have mid-level or high-level incidents each year.
Figure 1. Number of Firms Associated with ESG Incidents
Problems loading this infographic? - Please click here
Source: Man Numeric, RepRisk; as of 31 December 2021.
Region/Sector Controls: In terms of incident frequency by country, on average, European countries tend to have a higher incident frequency than other regions, likely driven by higher reporting standards and media scrutiny on ESG incidents in Europe (Figure 2). Regarding the incident frequency breakdown by sector, the energy sector tends to have more incidents related to environmental issues (Figure 3). The financial sector is associated with the most incidents in governance topics. Consumer discretionary and consumer staples sectors have more incidents in socialrelated topics. These variations in incident frequency are in line with expectations and the nature of different business models.
Figure 2. Average Annual ESG Incidents Per Firm by Region
Problems loading this infographic? - Please click here
Source: Man Numeric, RepRisk; as of 31 December 2021.
Figure 3. Average Annual ESG Incidents Per Firm by Sector
Problems loading this infographic? - Please click here
Source: Man Numeric, RepRisk; as of 31 December 2021.
Size controls: Looking at incident frequency by market capitalisation size, large companies tend to have more incidents than small companies (Figure 4). As shown below, large-size companies tend to have average yearly incident counts of six in each category of E, S and G. This is three times that of mid- and small-size companies in each ESG category. The large-cap bias in the data may result from the fact that large companies generally receive more media coverage and have more complex businesses with broader geographic reach.
Figure 4. Average Annual ESG Incidents Per Firm by Market Cap
Problems loading this infographic? - Please click here
Source: Man Numeric, RepRisk; as of 31 December 2021.
Past incident lead/lag controls: As discussed in Glossner (2021)5, ESG incidents tend to be serially correlated. Firms with past ESG incidents tend to experience future ESG incidents. We also found a strong lead/lag relationship in our incident data. Including past incidents helps isolate the impact from other predictor variables.
In summary, the ESG incident frequency of companies varies by region, by sector, by topic and by market-cap size. Firm incidents are serially correlated. Controlling for such biases helps evaluate how effective ESG ratings are at predicting future incidents.
Part II: Incident Model Specification
Model Specification
Controlling for ESG incident biases helps evaluate how effective ESG ratings are at reducing future incidents.
With the goal of predicting the probability of severe incidents happening, we construct a logit model for both developed markets (DM) and emerging markets (EM). The dependent variable indicates the occurrence, or not, of mid-level and high-level severity in the coming calendar year. Predictors in the logit model regression, include past incidents, ESG factors and various firm characteristics.
Incident-related variables include past incident indicators to account for the lead/lag effects described above. They are constructed at different levels of incident severity. The past incident indicator points to whether the company had a low severity or mid/ high severity incident in the past.
Given that companies with a better ESG factor score are expected to have fewer future incidents, the incident prediction model includes extensive ESG factors from leading ESG data providers, such as MSCI and Sustainalytics. In addition, firm-level characteristics – including style factors, region, country and sector – are included in the prediction model. This is to control for the incident frequency variation we documented in part I.
Incident Model Fitted Results
We evaluate the impact of various candidate incident drivers using a data sample from 2014 to 2021. We perform each logit model regression separately by E, S and G topics with predictors most related to the relevant topic (more details on E/S/G predictor grouping are below). Regardless of the incident topic, there are commonalities across the regressions in terms of incident prediction.
In line with previous descriptive analysis, past incidents are shown to predict future incidents. The Z scores of incident-related variables in the forecast model are positive and statistically significant, as shown in Figure 5. Past incidents with mid or high-level severity overall have stronger impacts across three models. This means that companies with a high number of past incidents tend to have a high number of future incidents, especially those companies with more severe incidents in the past
Figure 5. Z Scores for ESG Incidents by Past Incident Variables
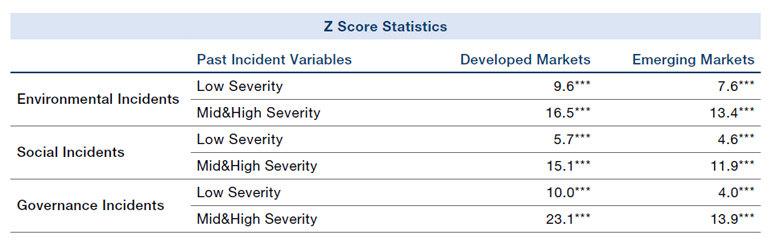
Source: Man Numeric, RepRisk; as of 31 December 2021.
Note: Z scores with *,**, and *** indicate statistical significance at the 10%, 5% and 1% levels.
Less profitable and cheap companies with recent selloffs are more likely to have future incidents.
Moreover, companies with poor profitability, negative momentum, large market capitalisation and high earnings-to-price (E/P) ratios are associated with a higher number of future incidents (Figure 6). In other words, less profitable and cheap companies with recent selloffs are more likely to have future incidents. These firms with cheap valuation and negative momentum may reflect the market’s appreciation for the higher risk of additional negative incidents, especially in the developed markets. These less profitable firms may also be under business pressure with limited resources to mitigate negative ESG incidents.
Figure 6. Z Scores for ESG Incidents by Barra Factors
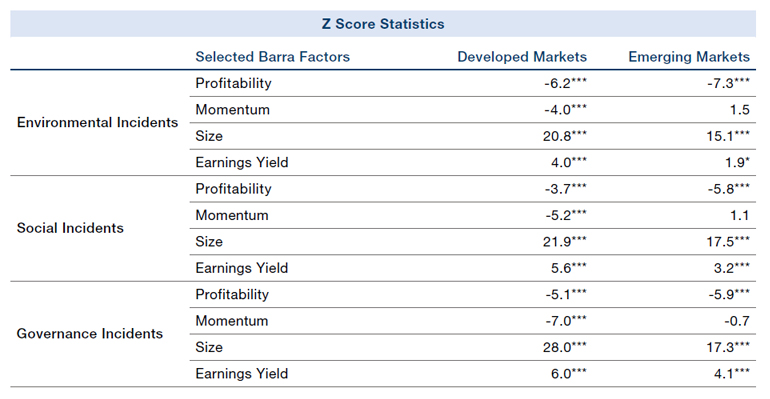
Source: Barra, Man Numeric, RepRisk; as of 31 December 2021.
Note: Z scores with *,**, and *** indicate statistical significance at the 10%, 5% and 1% levels.
Part III: Evaluation of Current ESG Metrics from Sustainalytics and MSCI
Firms with high ESG ratings from policy, self-disclosure and non-action-based factors continue to have high future incident rates. This potentially highlights ESG greenwashing concerns.
An effective ESG rating should be informative about future incident rates. A high ESG rating should be predictive of lower incident rates in the future. In this section, we investigate the effectiveness of hundreds of ESG factors and ESG key issues published by Sustainalytics and MSCI by studying their association with companies’ future incidents. In short, we obtained mixed results and the answer varies from vendor to vendor. We find that companies with high ESG scores due to strong board governance, effective compensation programmes, better reporting structure lead to lower future incident probability. These factors are informative and effective. However, we find that ESG scores related to company policy, self-disclosure and non-action-based factors are biased. Firms with high ESG scores in these categories continue to have high future incident rates. This potentially highlights ESG greenwashing concerns.
To better evaluate various ESG factors, we group granular ESG factors from each vendor into different thematic pillars under E, S and G topics for comparison. For example, environmental policies related to ESG factors will be grouped into a pillar called environmental policies under the E topic. Factors related to human capital will be grouped into human capital pillars under social topics. The classification table is available upon request. The following table shows the Z score statistics of ESG factors from a logit regression for both Sustainalytics and MSCI.
Sustainalytics:
- Better policy-related scores associated with high future incident frequency.
Policy-related ESG factors indicate whether companies have relevant policies in place to promote ESG-friendly activities, including policies to protect the environment in the environmental policies pillar, policies to eliminate discrimination in the human capital pillar, and policies to improve ethics and transparency in the ethics and transparency pillar. Data vendors generally extract this information directly from company fillings or surveys. A company could have a good policy-related ESG score if it responded that it has an in-house policy. However, this does not mean that the company is actually taking action to avoid discrimination or resolve problems in its environmentalrelated practices. As a result, many companies with perfect scores in areas such as environmental policies, human capital, ethics and transparency continue to have high future incidents. - Better board governance, effective compensation programme and better reporting scores associated with low future incident frequency.
Firms with better board governance and effective compensation programmes are associated with low future incident rates. The board of directors of these companies tends to have a more diverse background, which helps provide fresh insight into the boardroom and leads to better decision-making. In addition, these companies also tend to have a high degree of board independence with more effective management oversight and are less prone to conflicts of interest. As a result, these companies tend to do a better job of promoting ESG-friendly practices and have lower incident rates in the future.
MSCI:
- Better policy and self-disclosure-related scores in social topics associated with high future incident frequency.
Self-disclosure social factors reflect if firms have a social policy in place, such as policies to ensure social standards in the supply chain. However, like other policyrelated variables, self-disclosure ESG metrics do not guarantee that companies will make efforts to limit negative ESG activities that could lead to operational disruption. Therefore, many companies with good scores in these categories continue to have high future incidents. - ESG factors in environmental and governance topics show less statistical significance in predicting future incidents.
Overall, we find that key ESG factors from MSCI – especially in E and G topics – are insignificant in predicting future incident frequency (Figure 7). For example, though high MSCI ESG scores in the environmental policies pillar are associated with fewer future ESG incidents, the Z score is low and not statistically significant. This is because each ESG key factor from MSCI is already a combination of many more granular ESG indicators, including both policies and performance measures. Performance-related measures are more action-driven, but policy-related measures are subject to the same criticism as above. Therefore, the overall factors show low statistical significance in predicting future incidents.
Figure 7. Z Scores for ESG Incidents by Rating Provider
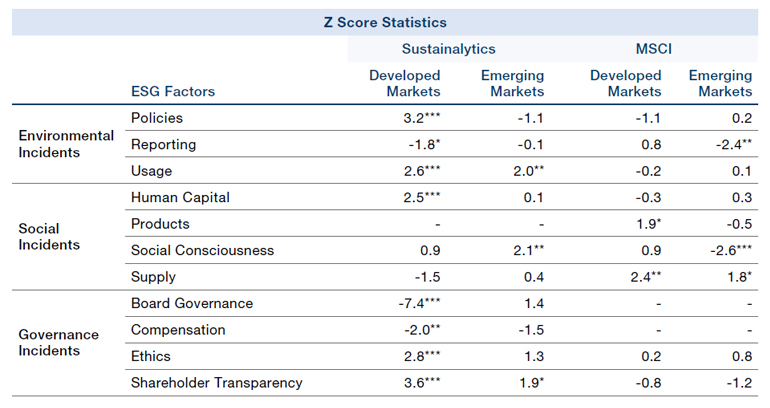
Source: Man Numeric, MSCI, Sustainalytics, RepRisk; as of 31 December 2021.
Note: Z scores with *,**, and *** indicate statistical significance at the 10%, 5% and 1% levels.
Part IV: Comparative Analysis Versus Third Party Solution
In this section, we will compare our incident prediction model with the third-party RRI solution discussed in part I to assess the quality of the model in terms of incident prediction accuracy.
As noted in part I, the third-party solution RRI index has scores that range from 0 to 100, with a higher number denoting a higher ESG incident rate. Scores below 25 are considered a low incident rate, 25-50 a medium incident rate, and scores greater than 50 a high incident rate.
The prediction accuracy test is designed to compare the accuracy of forecasting companies with mid- and high-level severity incidents in the next calendar year. To make a fair comparison, we take both the year-end risk index score and the year-end prediction probability score from the expanding window logit model. Firms are predicted to have a mid/high level of severe incidents by the RRI model if they have a year-end RRI index score greater than 25 (medium risk, as considered by RRI) or 50 (high risk, as considered by RRI). Similarly, companies are predicted to have a mid/high level of severe incidents if in our analysis they have an expanding window logit model year-end prediction probability greater than 0.5.
Our incident prediction model shows 20% higher prediction accuracy.
Compared with third-party solutions, our incident prediction model shows higher incident prediction accuracy. Figure 8 shows the prediction accuracy for each ESG category for both models. For example, our incident prediction model has 66% accuracy in predicting companies with serious E incidents in developed markets, compared with 48% or 51% accuracy in the RRI model, an approximately 30% improvement in prediction accuracy. On average across topics, our incident prediction model shows 20% higher prediction accuracy compared to RRI for both developed and emerging markets.
Figure 8. Prediction Accuracy
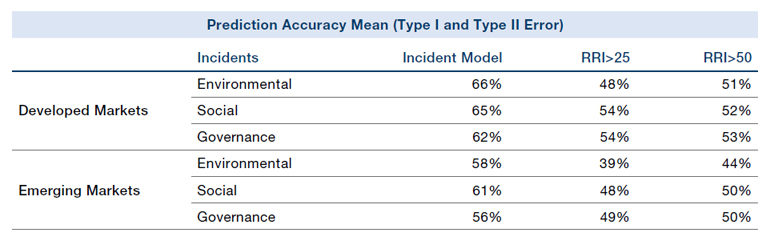
Source: Man Numeric, RepRisk; as of 31 December 2021.
Conclusion
We develop an incident prediction framework to evaluate how effective various ESG ratings are in mitigating negative ESG incidents and better managing headline risk. The incident model isolates the impact from ESG ratings after controlling for the impact from past incidents, factor biases, and region/sector biases as documented in the ESG literature.
The incident prediction model is applied to evaluate two mainstream ESG ratings provided by MSCI and Sustainalytics. Our findings show that companies’ in-house ESG policies and code of conduct are not effective enough to reduce future incident risk, especially when it comes to environmental protection, human capital discrimination, and supply-chain standards. In contrast, board governance with diverse backgrounds and independent oversight – as well as ESG ratings associated with specific performance measurement – are more effective to reduce incident risk in the future.
The incident prediction model can also be used to assess which companies are more likely to be involved in negative ESG incidents and so manage headline risk for ESG investors. Our incident model shows more accurate incident prediction than third-party solutions.
1. See, for example, www.forbes.com/sites/simonmoore/2021/04/12/new-research-sizes-the-costs-to-investors-of-ignoring-esg-risks/
2. Serafeim, G., Yoon, A. Stock price reactions to ESG news: the role of ESG ratings and disagreement. Rev Account Stud (2022). doi.org/10.1007/s11142-022-09675-3
3. Wee, J., Xiang, V., ESG Returns – As a Matter of Factor… (2022)
4. RepRisk, ESG data science and quantitative solutions. www.reprisk.com
5. Glossner, Simon, Repeat Offenders: ESG Incident Recidivism and Investor Underreaction (2021). http://dx.doi.org/10.2139/ssrn.3004689
You are now leaving Man Group’s website
You are leaving Man Group’s website and entering a third-party website that is not controlled, maintained, or monitored by Man Group. Man Group is not responsible for the content or availability of the third-party website. By leaving Man Group’s website, you will be subject to the third-party website’s terms, policies and/or notices, including those related to privacy and security, as applicable.