Policymakers eased monetary policy in the third quarter of 2019, with the first two Federal Reserve rate cuts in 11 years and the European Central Bank cutting interest rates further and announcing it would re-start quantitative easing in November. Global policy interest rates are now 1.7% according to Evercore ISI, and falling again.1 Indeed, Evercore ISI has counted 36 central banks that have cut rates in the six weeks to end-September.
There are, however, strong doubts about the efficacy of this latest round of rate cuts, doubts which are shared by the very people doing the cutting. ECB President Mario Draghi urged governments “with fiscal space [to] act in an effective and timely manner”, adding to the suggestion from his successor-to-be Christine Lagarde that a planned review of the fiscal regime “would create room for economies to use fiscal policy in downturns”.2
This was deemed necessary because the US 10-2s yield curve inverted in mid-August, the global purchasing managers’ index dipped below 50 in May and has stayed there since and the OECD global leading indicator is at new cycle lows (since 2008). More than a decade into the biggest monetary policy experiment since Weimar, the global economy is still struggling to break out of its torpor. To throw more grit in the gears, there have been concerns in some quarters that the Fed may even be losing control of monetary policy, with effective Fed funds breaking out of its IOER (interest on excess reserves) corridor amid fears that the commercial banking system is running out of excess reserves (more on this below).
All of this has taken its toll on Wall Street sentiment. Notably, Bank of America-Merrill Lynch’s Bull & Bear indicator hit a level of 0.7 out of 10, a level it calls ‘extreme bearishness’. This level has been reached only eight times in the last 20 years and has been a good timing signal to take more risk. The bank’s emerging-market Risk Love indicator reached ‘panic’ territory in August too. Our own stock-bond models issued decisive buy signals for equity in all four regions (Europe, US, Japan and EM) and the Morgan Stanley Combined Market Timing Indicator gave an overall buy signal to boot.
Staying true to our process, with the Fire & Ice regime still in the Reflation zone, characterised by negative stock-bond correlation and no outright deflation, our inclination is to remain positive on equity and credit risk, and negative on duration risk.
Alarm Bells
However, when alarm bells are ringing, we need to at least investigate whether there is actually a fire. The two areas of most alarm are:
- Fed funds breaking out of its corridor;
- The 10-2s curve inversion.
Let’s take them in order.
The first question is, can the Fed lose control of Fed funds? Our simple answer is, no! To accept this view, we need to briefly review how the Fed funds corridor system works. Here is our understanding of it.
When QE started to flood the commercial banking system with excess reserves, repo operations became irrelevant because no-one needed dollar liquidity, so no-one needed to post collateral and pay an interest rate on the dollars they received. Instead, the Fed started paying IOER, which became the new ceiling for effective Fed funds (Figure 1). When there is no demand for reserves, and the only entity paying for reserves is the Fed, the IOER becomes the maximum interest rate. The Federal home loan banks (Fannie Mae and Freddie Mac) had excess dollar liquidity but no access to the IOER, so would deposit their dollars at banks which did have access, which in turn would put those funds to the Fed and receive IOER. So, the effective Fed funds (the rate received by Fannie and Freddie) was at a rate slightly below the IOER.
Then in late 2018, this started to change. Some entities must have run out of excess reserves but needed dollar liquidity and were thus forced to pay up for funds. Entities with excess dollar balances (Fannie and Freddie) now had a way of receiving a higher interest rate than was available via their accounts at the banks, and the repo rate became the ceiling again. Then on 17-18 September, 2019, the effective Fed funds rate spiked way through the repo rate (Figure 1). People started to talk about the Fed losing control.
Figure 1. Fed Funds Corridor and Effective Rate
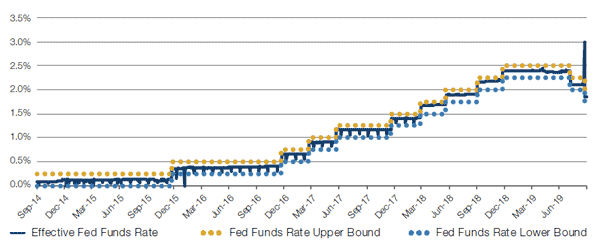
As of 23 September, 2019.
Far from losing control, what the Fed did was to re-open repo operations, and immediately, the effective Fed funds fell back into its corridor. In our opinion, it’s not possible for the Fed to lose control of Fed funds as long as banks have either sufficient excess reserves or sufficient repo collateral. Re-starting QE is the big bazooka way of dealing with a liquidity shortfall. Re-starting repo operations is the small bazooka way. In extremis, the Fed can also relax collateral requirements by broadening eligibility criteria if some banks start to run out of collateral. Both work and both are within the tool-box of the Fed, as they have just demonstrated. Panic over!
Now let’s consider the second area of concern. Will the yield curve inversion cause a market correction?
The cash 10-2s yield curve inverted briefly on 14 August, then on 26 August and stayed inverted until 3 September. It has since “un-inverted” (to use Fed Governor James Bullard’s phrase). We have long taken curve inversions seriously and have observed in two prior cycles that there has been a tendency in the market to ignore them when they happen because “it’s different this time”.
We think it’s virtually never different this time, and we also act on this belief! However, as we have explained in
‘Do 10-2 Inversions Matter?'
Are We Missing Anything?
So, having dismissed the two current market concerns, we look again to our cycle indicators to see if we are missing anything.
Our Cycle Tracker is not pointing to imminent recession. Inflation remains quiescent, meaning the Fed can be loose, which has un-inverted the 10-2s yield curve, allowing credit spreads to remain tight and weekly initial unemployment claims are just very slightly off 50-year lows. Our leading indicator is also still pointing to a strong recovery in the US purchasing managers’ index over coming quarters, driven by lower input costs for business, the recent rise in government bond yields from low levels and the outperformance of early cycle versus late cycle stocks.
The US and global cycle has had three mini-cycle slowdowns since the 2008-09 recession: a peak in April 2010, trough in March 2013; peak in July 2014, trough in June 2016; and a peak in September 2018 (Figure 2). The magnitude of the slowdown is similar to the prior two slowdowns, even if the duration is just one year after two years and three years in the two prior episodes. On balance, we think we are most likely now approaching the third mini-cycle low in global activity. Usually, that’s when one should buy equity risk.
Figure 2. At the Mini-Cycle Low. Conference Board LEI YoY
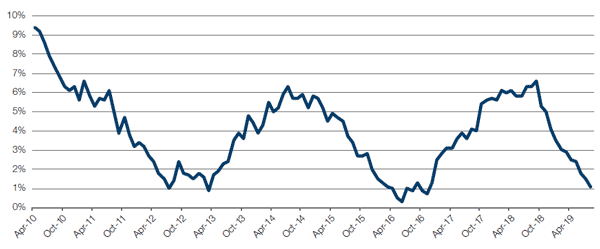
As of 31 August, 2019.
Conclusion
Bottom line: We don’t see an imminent recession and earnings revisions are no worse than normal. As such, we are happy to remain positive on equity and credit risk, and negative on bond duration. It’s not over til it’s over.
1. As of 30 September, 2019.
2. Source: Financial Times.
You are now leaving Man Group’s website
You are leaving Man Group’s website and entering a third-party website that is not controlled, maintained, or monitored by Man Group. Man Group is not responsible for the content or availability of the third-party website. By leaving Man Group’s website, you will be subject to the third-party website’s terms, policies and/or notices, including those related to privacy and security, as applicable.