Drawing on Dickensian duality, ESG performance in 2023 mirrored the stark contrasts of the great writer’s “A Tale of Two Cities” – “it was the best of times, it was the worst of times....it was the season of Light, it was the season of Darkness...” On the one hand, we saw ESG indices outperforming their non-ESG counterparts whilst at the same time, active ESG managers struggled versus their non-ESG peers and their respective benchmarks.
Last year provided a challenging market backdrop for sustainable investors; higher rates, poor performance of widely-held ESG stocks and rising anti-ESG sentiment related to upcoming elections (particularly in the US and Europe) all contributed to increasing uncertainty for sustainable investors.
This paper outlines key insights from an in-depth analysis of ESG performance and flows: digging deeper into the drivers of the key trends which dominated the ESG landscape last year and highlighting key themes for ESG investors to look out for in 2024.
ESG Indices Performance
It was the ‘season of Light’ at the index level, with MSCI’s ESG indices outperforming their relevant standard indices, with the exception of emerging markets [Figure 1].
Figure 1. ESG indices vs standard indices performance
Problems loading this infographic? - Please click here
Source: MSCI, Bloomberg, Man RI Research.
Outperformance was driven by a handful of key overweights in the ESG Indices [Table 1a]. The top five companies overweight in MSCI-US ESG versus MSCI-US all posted returns at least double that of the standard index. Those names also drove the relative outperformance of MSCI-World ESG given the large US weight in that Index.
Table 1a. Top 5 Overweights (MSCI-US ESG versus MSCI-US)
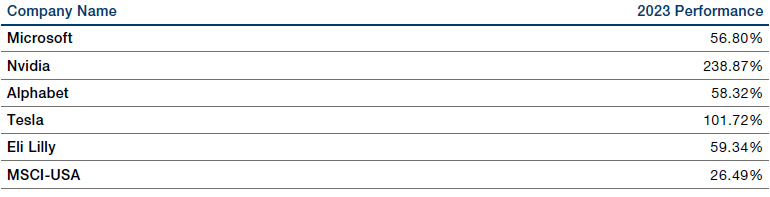
Source: MSCI, Bloomberg.
In a similar vein, the underperformance of ESG at the index level in emerging markets was a result of weak performance in key overweight companies [Table 1b]. While the largest overweight, Taiwan Semiconductor, outperformed thanks to ChatGPT enthusiasm, three out of the remaining five top overweights underperformed the index.
Table 1b: Top 5 Overweights (MSCI-EM ESG versus MSCI-EM)
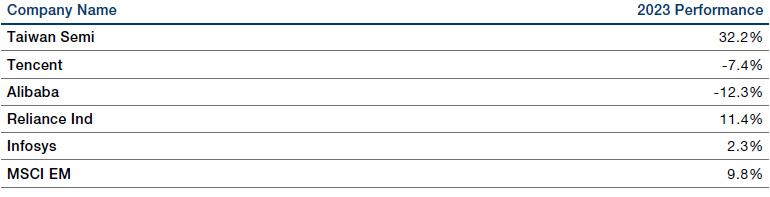
Source: MSCI, Bloomberg.
ESG Fund Performance
ESG fund performance notably struggled over 2023; marking a ‘season of Darkness’ for active ESG managers.
Our analysis of ESG fund performance focuses on the EU Sustainable Finance Disclosure Regulation (‘SFDR’) fund categories; Article 6, Article 8 and Article 91. The split of equity funds across the three buckets is as follows [Figure 2]: 4,322 funds and USD 1,968.6bn of assets in Article 6, 5,625 funds and USD 2,885.5bn of assets in Article 8 and 637 funds and USD 239.5bn of assets in the greenest Article 9 as of 31 of December 2023.
Similarly, for fixed income the split is as follows [Figure 3]: 3,261 funds and USD 1,403.3bn of assets in Article 6, 3,250 funds and USD 1,647.6bn of assets in Article 8 and 275 funds and USD 84.7bn of assets in Article 9.
Figure 2. Split of funds by SFDR (Equity)
Problems loading this infographic? - Please click here
Source: Morningstar, Man RI Research.
Figure 3. Split of funds by SFDR (Fixed Income)
Problems loading this infographic? - Please click here
Source: Morningstar, Man RI Research.
In 2023, it was certainly ‘the worst of times’ for Equity ESG funds [Figure 4]. The average Article 8 fund underperformed its prospectus-stated benchmark by 0.84%2, while the average Article 9 fund lagged its stated benchmark by a whopping 6.16%. In contrast, non-ESG Article 6 funds fared much better, only underperforming their benchmark marginally by 0.17% during 2023.
Figure 4. Equity Funds Weighted Average Excess Returns (USD)
Problems loading this infographic? - Please click here
Source: Morningstar, Man RI Research.
Fixed income ESG funds fared better than equity ESG funds, with both Article 8 and Article 9 funds finishing the year ahead of their prospectus-stated benchmarks [Figure 5]. However, non-ESG Article 6 fixed income funds boasted the strongest performance, beating their benchmarks by 0.48% on average during the year.
Figure 5. Fixed Income Funds Weighted Average Excess Returns (USD)
Problems loading this infographic? - Please click here
Source: Morningstar, Man RI Research.
Drivers of ESG Underperformance
The overall performance of active ESG funds was multi-faceted and nuanced, driven by several interacting factors. The next section disentangles some of the key themes and drivers which contributed to underperformance over the year. There’ll be a particular focus on equity ESG funds, given their dramatic underperformance.
Factor Returns
One cause relates to the poor performance of ESG factors more generally, driven by a combination of higher rates, fund outflows and rising anti-ESG sentiment across certain regions ahead of upcoming elections. The Barra ESG factor was one of the worst performing factors for 2023 and the Barra Carbon Efficiency factor also performed poorly for the first nine months of 2023, before staging a rebound in the fourth quarter [Figure 6].
Figure 6. Barra Inter-quintile Factor Spreads, Global Top 1,500
Problems loading this infographic? - Please click here
Source: MSCI Barra, Man Numeric, Man RI Research
ESG Fund Sector Exposure and Returns
ESG equity funds are generally overweight Industrials, Materials and Healthcare and underweight Financials, Energy, Tech and Communication Services [Figure 7]. This may come as a surprise to many people, as often ESG is simply viewed as a long tech / short energy trade. Overall, most of these sector bets hurt active ESG funds, especially the underweight to Tech and Communication Services when those stocks led the market throughout 2023 [Figure 8].
Figure 7. Relative Sector Weight of Active Article 8 and Article 9 Funds (versus MSCI ACWI)
Problems loading this infographic? - Please click here
Source: Morningstar, Factset, Man RI Research.
Figure 8. 2023 Sector Returns
Problems loading this infographic? - Please click here
Source: Bloomberg, MSCI, S&P, Man RI Research.
Interest Rates
Throughout 2023, higher interest rates posed financial headwinds for clean energy stocks, with a twofold negative impact. Clean energy investments are typically vulnerable to rising borrowing costs as they involve high upfront costs that are compensated over time by much lower operating expenses. At the same time, it’s capital intensive for end-consumers to invest in renewable energy, such as solar panels, thus demand for renewables may decrease when rates rise with consumers already feeling the effects of inflation and dwindling savings.
Figure 9 shows the relationship between interest rates and clean energy stocks represented by ICLN, an ETF that tracks a global basket of wind, solar and alternative energy stocks. We can see that interest rates were generally rangebound for the first six months of the year but rose over 100 basis points, from 3.85% on June 30th to 4.93% on October 31st. In response, ICLN fell 29.3% while MSCI World only dropped 6.2%, an underperformance of over 2,300 basis points in four months. Then, as rates fell 105 basis points in the final two months of the year, ICLN outperformed MSCI World by over 490 basis points.
Figure 9. Interest Rates and Clean Energy Stocks
Problems loading this infographic? - Please click here
Source: Bloomberg, MSCI, Blackrock, Man RI Research.
ESG Fund Flows
Despite the underperformance of ESG funds, we continued to witness the resilience of ESG flows. Flows into Article 8 and 9 funds increased dramatically in 2021 and 2022, post the launch of the EU SFDR which contributed to heightened investor interest in ESG [Figure 10]. During 2023, cumulative flows into Article 8 and Article 9 declined, but the majority of that occurred in the second half of the year which coincided with rising rates and weak clean energy stock returns [Figure 9]. However, Article 6 funds saw consistent inflows throughout the year especially as year-end approached; perhaps unsurprising given the stronger relative performance of Article 6 funds over the year.
Figure 10. Cumulative Equity Flows into Article 6, 8 and 9 Funds*
Problems loading this infographic? - Please click here
*Since the launch of SFDR in March 2021.
Source: Morningstar, Man RI Research.
Figure 11. Cumulative Equity Flows into Article 6, 8 and 9 Funds
Problems loading this infographic? - Please click here
Source: Morningstar, Man RI Research.
Like equity funds, Article 8 and 9 fixed income funds saw a similar surge in flows as SFDR came into play in 2021 [Figure 12]. After dipping in 2022, inflows were sustained in 2023 across all three SFDR categories perhaps attracted by higher nominal rates [Figure 13]. Strong relative performance of Article 6 funds [Figure 5] likely helped support flows into that category. It is interesting to note that absolute flows into fixed income funds were significantly higher across all categories than equity funds [Figure 11 versus Figure 13] despite the robust equity markets and sanguine bond markets.
Figure 12. Cumulative Fixed Income Flows into Article 6, 8 and 9 Funds*
Problems loading this infographic? - Please click here
*Since the launch of SFDR in March 2021.
Source: Morningstar, Man RI Research
Figure 13. Cumulative Fixed Income Flows into Article 6, 8 and 9 Funds
Problems loading this infographic? - Please click here
Source: Morningstar, Man RI Research.
Looking ahead to 2024...
Despite the challenging environment for sustainable investing over 2023, we are hoping 2024 will mirror the title of a different Dickens classic: Great Expectations. There are some key themes that may drive better relative returns for sustainability-oriented securities:
- Weak 2023 performance has led to much more attractive multiples for many ‘green’ stocks. Additionally there is evidence that factors tend to revert.
- The widely-expected lower interest rates should lessen the interest carry for both corporates and consumers. A lower rate environment is generally viewed as a positive tailwind for renewables.
- 2024 marks a major election year, where pro-environment, typically left-leaning governments are polling poorly thus far. Despite this, we continue to expect increased capital spending on climate solutions at both the corporate and government level to achieve Net Zero. Companies continue to see the opportunities in energy transition and even political parties that appear anti-ESG see the benefits of clean energy factors and jobs in their districts.
- Growing awareness of the financial materiality of ESG factors. For example, a wave of nature-related legislation and regulation is on the horizon for 2024, potentially increasing the financial materiality of this theme through corporates being exposed to heightened non-physical risks.
1. Article 6: Funds without a sustainability scope. Article 8: Funds that promote environmental or social characteristics. Article 9: Funds that have sustainable investment as their objective.
2. All fund-level performance analysis in this section uses Morningstar data. It is calculated using AUM-weighted average excess returns in USD, calculated by using each fund’s prospectus-stated benchmarks. Only funds with valid IDs (ISIN in this case) and none-zero AUM are included.
With thanks to Song Jie (RI Research Analyst) and Shiying Ma (Graduate Analyst) for their significant contribution to this paper.
You are now leaving Man Group’s website
You are leaving Man Group’s website and entering a third-party website that is not controlled, maintained, or monitored by Man Group. Man Group is not responsible for the content or availability of the third-party website. By leaving Man Group’s website, you will be subject to the third-party website’s terms, policies and/or notices, including those related to privacy and security, as applicable.