A Perfect Storm: Logic Semiconductors
When the White House says it is “a top and immediate priority”1, you know it’s serious. No, we’re not talking about geopolitics, the pandemic or trade wars, but instead the logic semiconductor chip shortage.
The chip shortage was heightened by the coronavirus pandemic, when demand for vehicles fell, leading to many auto manufacturers slashing their semiconductor orders. As auto companies cut orders, suppliers reduced their capacity.
However, the capacity freed up by auto demand at foundries was quickly backfilled by orders from personal computers, driven by home-schooling needs and as cryptocurrency mining gained popularity.
This led to foundry capacity in late 2020 being the tightest in recent years, with capacity essentially being sold out and utilisation exceeding 100%. Indeed, in February 2021, lead times (i.e., the duration between when an order for a chip is placed and when it actually gets filled) stretched to 15 weeks on average for the first time (Figure 1).
One potential side-effect to this issue of tight supply and extended lead times is that end customers are likely to over-order in the hope that a partial fulfilment will be enough to carry them, a phenomenon known as double-ordering. Tight supply therefore typically leads to greater demand, which puts even more pressures on supply in a not-so-virtuous cycle. And while the weakness in cryptocurrency prices could relieve some pressure as demand for GPU declines, there is little transparency about the scale of this in the overall demand for logic semiconductor chips.
Given the low channel inventories, we expect this supply tightness to sustain, at least for a few more months.
Figure 1. Lead Times for Chips at a Peak
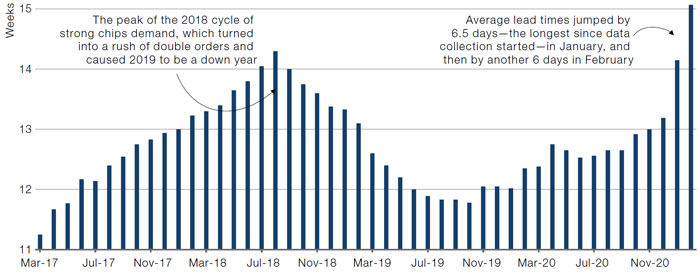
Source: Bloomberg; as of 31 March 2021.
Upstream Versus Downstream During Margin Squeezes
Over the past few weeks, we have been talking about the increase in raw material prices – from lumber to iron ore. Using downstream prices less upstream prices (or CPI less PPI) as a proxy for a margin squeeze demonstrates that we are currently in the bottom 4% in the history of the data series that goes back to the 1940s (Figure 2). The two worst incidents were pre the Lehman crisis (when crude hit USD150 per barrel) and in the mid-1970s.
Figure 3 shows 12-month forward returns for the 17 Fama-French industry groupings after a 95th percentile event on the margin proxy. Intuitively, the ‘upstream’ sectors – food producers, agri businesses, oil, chemicals, regulated utilities – have done reasonably well in tight margin environments. The ‘downstream’ sectors – auto manufacturers, construction, clothing manufactures – fared badly.
It’s also notable that following these squeeze periods, the ISM manufacturing index, and S&P 500 EPS growth have rolled over materially in the next 12 months. Now, this time might be different. It is conceivable that operating leverage will overcome raw material cost pressures, if the pace of the recovery persists.
Problems loading this infographic? - Please click here
Source: Man GLG; as of 31 March 2021.
Figure 3. 12-Month Forward Returns Per Sector Following a 95th Percentile Margin Squeeze
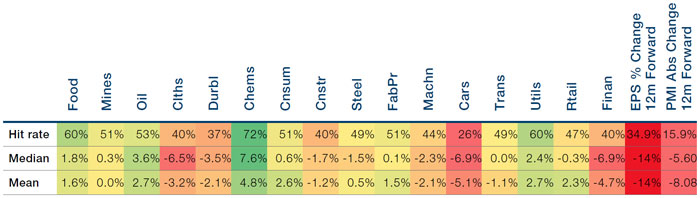
Source: Man GLG; as of 31 March 2021.
With contribution from: Ruofan Ni (Man Group, Graduate Analyst) and Ed Cole (Man GLG, Managing Director – Discretionary Investments).
1. Source: https://www.bbc.co.uk/news/technology-56847518.
You are now leaving Man Group’s website
You are leaving Man Group’s website and entering a third-party website that is not controlled, maintained, or monitored by Man Group. Man Group is not responsible for the content or availability of the third-party website. By leaving Man Group’s website, you will be subject to the third-party website’s terms, policies and/or notices, including those related to privacy and security, as applicable.