Occam’s Razor: Commodity Prices…
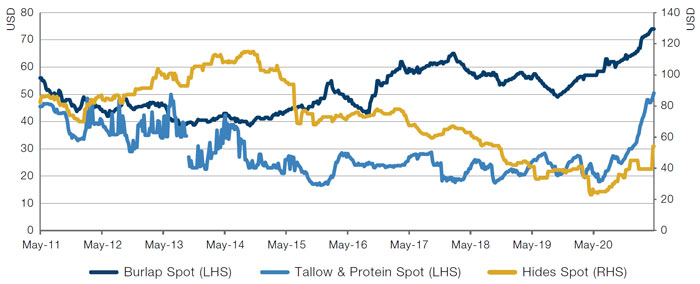
A couple of weeks ago, it was lumber prices. Now, it’s Dalian iron ore prices, which reached a record high of USD206 a ton. And copper specs, off from their highs but still elevated. And burlap. And tallow. Even animal hide prices are up (Figures 1-3). On this basis, we think it is fair to say that commodity inflation has well and truly set in, and has been passed on through to consumers. Prints like the 4.2% April US CPI aren’t just base effect.
The counter argument is that we shouldn’t jump the gun. Some of these measures contain speculative components, either directly or as producers try to jump ahead of further price increases for the spot-only commodities.
To this, we would point to the cost of shipping, which has reached its highest level in a decade (Figure 4). While some speculation is undeniable, unless investors are doing so by shipping vast quantities of physical commodities (and Occam’s razor would suggest they are not), we must also be looking at proper, demand-driven inflation in commodities.
Problems loading this infographic? - Please click here
Source: Bloomberg; as of 13 May 2021.
Problems loading this infographic? - Please click here
Source: Bloomberg; as of 13 May 2021.
Figure 3. Burlap, Hides and Tallow Prices
Source: Bloomberg; as of 13 May 2021.
Problems loading this infographic? - Please click here
Source: Bloomberg; as of 13 May 2021.
Note: Contributing timecharter averages 40% Capesize, 30% Panamax, 30% Supramax
…In Long-Term Perspective
However, it is important to look away from commodity inflation and think about where this general inflationary bump goes over the long term.
The dark blue line in Figure 5 shows the median of the FOMC’s long-run projections for the Federal Reserve’s target overnight rate. Known as the ‘dot plot’, it represents where Fed board members think the long-run interest rate should be. This is plotted against the US 5-year 5-year, an estimate of where the 5-year forward rate will be in five years’ time, the US 5-year inflation breakeven and the current upper bound of the overnight rate.
It looks like we’ve reached a point where the market’s long-run policy rate expectations got close to the Fed’s normalised long-term level and then fell back – a recognition that while the global economy is healing faster than expected, pricing full rate normalisation into a still fragile recovery may have been a tad too far.
Indeed, the breakeven curve has inverted, with the spread between US 30-year and 5-year inflation breakevens now negative (Figure 6). The shape of the curve implies that market participants expect this inflationary bump to be short-lived, with lower inflation over the long term than the short term.
Problems loading this infographic? - Please click here
Source: Bloomberg; as of 13 May 2021.
Problems loading this infographic? - Please click here
Source: Bloomberg; as of 13 May 2021.
What Happens When Central Banks Weigh In on Equities?
Ten years after launching its ETF purchase programme, the Bank of Japan has made a major policy revision: it has abandoned the minimum equity purchasing target and restricted its purchasing to the Topix.
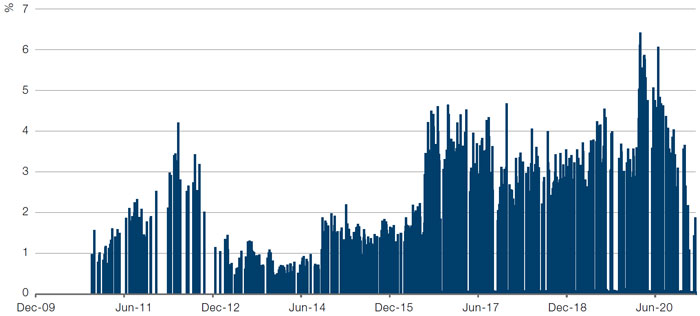
Using ETFs to support the broader Japanese equity market, at its peak during the coronacrisis, BoJ purchases represented about 6% of daily volume on the Tokyo Stock Exchange, but also regularly exceeded 1% of daily volume since inception (Figure 7).
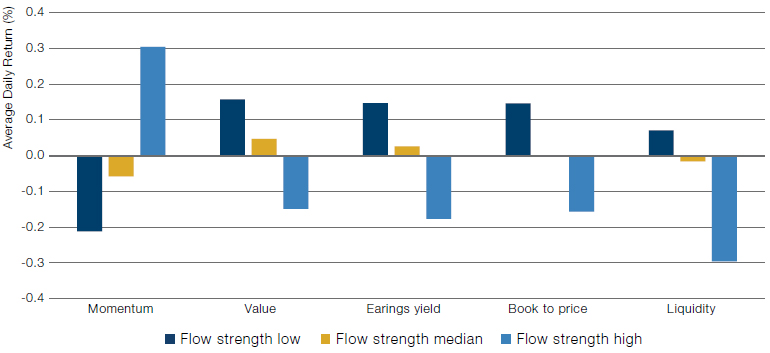
As one would expect, such large order flows have had an effect on returns. Analysis of factor performance over the past decade shows that Momentum stocks and illiquid names have benefitted the most from BoJ purchasing (Figure 8). While the underperformance of Value has been a global theme, the BoJ flow may have amplified its underperformance in Japan over this period.
Figure 7. BoJ ETF Purchase Flow as % of TSE1 Daily Volume
Source: Man Numeric; as of 31 March 2021.
Figure 8. Barra Factor Performance (Conditioning on BOJ ETF Purchase Flow, 2011-2020)
Source: Man Numeric; as of 31 March 2021.
With contribution from: Ed Cole (Man GLG, Managing Director – Discretionary Investments) and Ethan Gao (Man Numeric, Associate Portfolio Manager).
You are now leaving Man Group’s website
You are leaving Man Group’s website and entering a third-party website that is not controlled, maintained, or monitored by Man Group. Man Group is not responsible for the content or availability of the third-party website. By leaving Man Group’s website, you will be subject to the third-party website’s terms, policies and/or notices, including those related to privacy and security, as applicable.