Breadth. Finally.
It sometimes felt like the 2010s were a decade-long pile on, with investors aggressively buying into a small cohort of similar stocks – usually large-cap Growth. Returns reflected the mood, slowly becoming more concentrated. By 2020, only 34% of the constituents of the S&P 500 Index outperformed the index and the top 10 contributors had excess returns of almost 8% compared to the broader index, levels not seen since the dotcom bubble that burst in 2000 (Figures 1-2).
This trend was reflected globally, with 2020 the nadir of market breadth for the MSCI Japan, EM and World indices, as well as the Russell 2000 (Figure 3).
Happily, 2021 seems to be a year in which we have bid concentration farewell. As of the end of the first quarter, some 59% of constituents have outperformed the S&P 500, and excess returns to the biggest contributors are at less than 2%. Again, this trend has been matched globally.
All things being equal, improved breadth should be beneficial for active managers: more stocks outperforming should create a larger opportunity set for stock selection.
Problems loading this infographic? - Please click here
Source: Man Numeric; as of 31 March 2021.
Problems loading this infographic? - Please click here
Source: Man Numeric; as of 31 March 2021.
Past performance is not indicative of future results.
Problems loading this infographic? - Please click here
Source: Man Numeric; as of 31 March 2021.
Past performance is not indicative of future results.
Stick or Twist? The PBOC and the Monetary Policy Tightrope
How does one slow credit growth so that it doesn’t fuel unsustainable indebtedness while still helping economic recovery post a pandemic?
This is exactly the problem facing The People’s Bank of China, which is walking a monetary policy tightrope between easing and tightening.
There is a continuing need to extend credit to support the economic recovery, particularly to SMEs and in sectors which employ large numbers of workers.
However, credit growth pushed China’s debt-to-GDP ratio to more than 280% in 2020 – the highest on record – according to the Financial Times, quoting research from JPMorgan. Furthermore, concerns about leverage within the property sector and rising property inflation also points to a need for tightening to maintain financial stability.
Chinese consumer debt is also a weak spot. While the percentage of consumer non-mortgage debt is small, it represents an outsized proportion of the overall debt service burden (Figures 4-5). What is also notable is that consumers with lower income in lower tier cities and in younger cohorts have a higher debt service burden (Figure 6).
Figure 4. Breakdown of Household Debt Outstanding
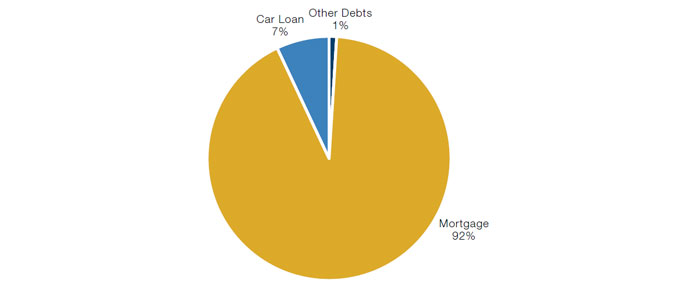
Source: UBS; as of 3 March 2021.
Figure 5. Breakdown of Debt Service Burden
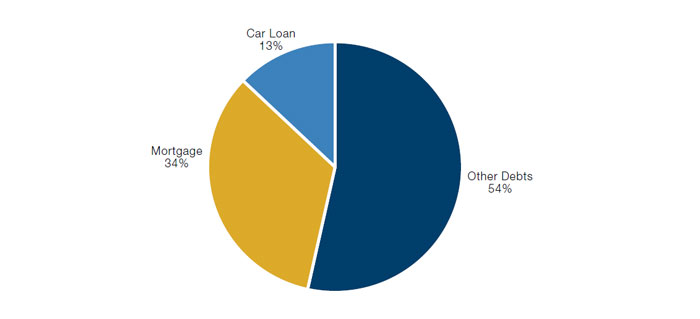
Source: UBS; as of 3 March 2021.
Figure 6. Debt Service Burden as a Share of Income
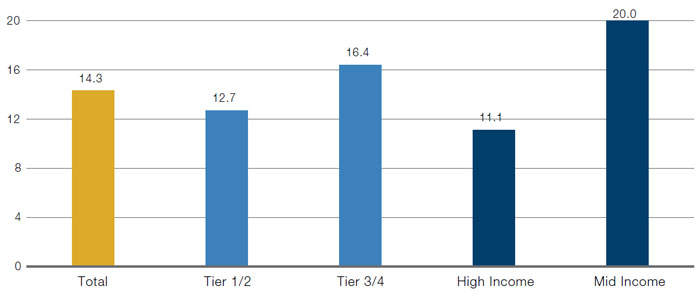
Source: UBS; as of 3 March 2021.
If A Tree Falls in the Forest, Can We Build a House Out of It?
US wood prices have soared this year, outperforming the Bloomberg Commodities index by 48 percentage points, driven by both higher demand from housebuilders as well as lower supply.
Lumber is a key building material in the US, where about 90% of houses are wood framed. New homes sales in the US have increased significantly (Figure 7). At the same time, a year in which people have spent more time than ever before in their homes because of the pandemic has contributed to a boom in home improvement activity.
Supply-side constraints have been driven by three factors. At the beginning of the pandemic, sawmills reduced production in expectation of plunging demand, similar to the Global Financial Crisis. Dealers also ordered less materials and ran down their inventories. Additionally, the volume of Canadian imports, which supplies about a third of US lumber, have reduced due to tariffs.
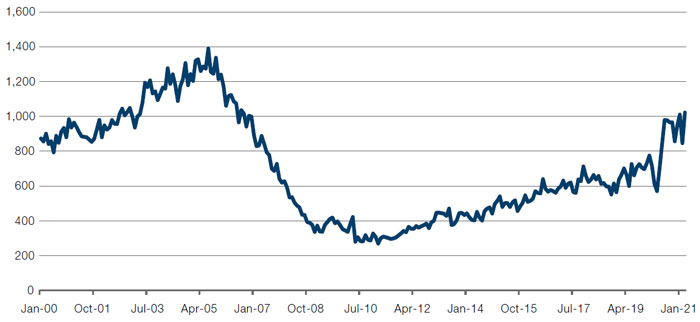
Figure 7. First Lumber Future Versus Bloomberg Commodities Index
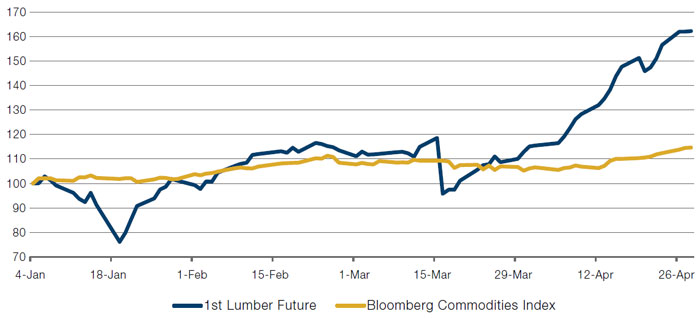
Source: Bloomberg; as of 28 April 2021.
Normalised to 100 as of 4 January 2021.
Figure 8. US New One Family Home Sales
Source: Bloomberg; as of 28 April 2021.
With contribution from: Jeremy Wee (Man Numeric – Senior Portfolio Manager) Ethan Gao (Man Numeric – Associate Portfolio Manager and Edward Cole (Man GLG, Managing Director – Discretionary Investments).
You are now leaving Man Group’s website
You are leaving Man Group’s website and entering a third-party website that is not controlled, maintained, or monitored by Man Group. Man Group is not responsible for the content or availability of the third-party website. By leaving Man Group’s website, you will be subject to the third-party website’s terms, policies and/or notices, including those related to privacy and security, as applicable.