Key takeaways:
- Traditional defensive equity strategies don't always work when investors need them most: Large Caps offer minimal protection, raw Quality factors often demonstrate their defensive characteristics several weeks into a downturn, and Low Volatility can fail during severe market stress
- We identified approaches that perform better: bias-adjusted Quality strategies remove anti-growth tilts, whilst tail-risk-managed Low-Volatility strategies reduce losses from 60% to 46% of market declines through better protection against extreme market moves
- Our analysis shows that alpha-driven and risk-based approaches are diversifying in their safety mechanisms, making room for both in any equities portfolio
While the post-Liberation Day market snapback has thus far rewarded risk-taking, volatility is at risk of spiking again amidst the ever-changing tariff environment and constantly smouldering geopolitical tensions. We believe this backdrop of heightened uncertainty demands a fresh look at defensive equity strategies.
Furthermore, our research suggests that over the past 20 years, market cycles have lengthened, with bull and bear runs roughly doubling in duration.
This creates a double challenge for investors: longer bear markets mean extended periods of relying on defensive protection, while extended bull markets amplify the opportunity cost of strategies that sacrifice too much upside for safety.
In this paper, we analyse traditional defensive equity strategies like Low-Volatility, Quality, and Large-Cap to identify their weaknesses during downturns, then test which targeted modifications can improve their effectiveness. We also assess alternatives like buffered ETFs.
This year has highlighted how quickly defensive strategy performance can change, with Low-Volatility and Quality performance shifting their relative effectiveness over the course of just a few days.
To understand these dynamics, we took a comprehensive analytical approach, using submergence density (which measures how long strategies remain under water)1 and Monte Carlo simulations to test how Low-Volatility strategies perform across a statistically significant set of market scenarios.
Key findings
We found that whilst each of the traditional defensive approaches provides a starting point for limiting losses, their performance is shaped by inherent biases and trade-offs. Depending on the market exposure targeted, Low-Volatility strategies can still lose 60% of what markets lose and perform worse during severe stress; simple Quality strategies provide modest protection and take several weeks to work, and large-cap strategies offer no meaningful protection.
However, our simulations showed that some modifications address these weaknesses. Tail-risk managed Low-Volatility strategies can reduce losses from 60% to 46% of market declines, whilst risk-adjusted Quality strategies remove anti-growth biases and provide more upside participation.
Buffered ETFs: popular but problematic
Buffered ETFs aren't the main focus of this analysis but given their popularity – attracting over US$36 billion in inflows over three years and an increase of 14% over the past six months alone – they warrant brief examination before we turn to more traditional defensive strategies.
On paper, buffered ETFs look attractive. They operate as self-financed put options with a band of protection that shields investors from losses and essentially offers downside insurance. However, they come with significant trade-offs. At their core, these products are simply beta-reduction strategies, and their structural limitations become evident in practice.
The most critical risk is timing. Investors who do not enter these ETFs at the option strike date risk a different return profile and may not receive the stated ‘guaranteed’ savings. For example: if the options are struck and the index immediately gains 10%, an investor buying in at that point faces a problem. As the 10% downside buffer was set according to the original strike price, protection only starts when the new investor has incurred a 20% loss.
The opportunity cost can be substantial. Simulating a yearly rebalanced buffered ETF with 10% downside protection back to 2010 using S&P 500 index options (Figure 1) reveals that the upside cap results in meaningful losses during strong bull markets. In 2021, for example, investors would have forfeited over 10% in opportunity cost. Similar drag occurred in 2014.
Buffered ETFs also suffer from persistent portfolio drag in less volatile markets from the cost of investment, where the protective put options fail to generate gains or benefits. This raises broader questions about their usefulness relative to alpha-driven or risk-based defensive strategies. However, they’ve become quite popular, likely due to the promise of guaranteed savings.
Figure 1: Buffered ETFs: opportunity cost during bull market
Problems loading this infographic? - Please click here
Source: Numeric calculations using Bloomberg, Refinitiv data, as of 31 December 2024.
Why traditional strategies fall short
Traditional defensive equity strategies such as Large Cap, simple Quality, and Low-Volatility have long been considered effective tools for reducing downside losses during market drawdowns.
The reality is that Large Caps have produced very little downside protection, and simple Quality offers relatively modest protection as its payoff can be delayed. Low Volatility improves the downside performance but also misses out on more upside, reducing its risk-adjusted benefit. However, each of these limitations can be addressed through specific enhancements.
Figure 2: The downside versus upside capture
Problems loading this infographic? - Please click here
Sources: Man Numeric calculations using Bloomberg and MSCI data from 1 May 2006 to 31 August 2025.
Low-Volatility strategies, for example, typically lose only 60% of what a market loses during a downturn, providing effective protection most of the time. However, this protection comes with a trade-off: these strategies concentrate risk on the market’s worst moments.
During markets’ worst days – the bottom 1% of all trading days – Low-Volatility strategies lose an additional 1% on average compared to the broader market (Figure 3.) This is due, in part, to these periods often featuring severe market concentration, which doesn’t allow for the typical benefits of diversification. By building Low-Volatility portfolios with a focus on extreme market movements and faster risk mitigation techniques, it is possible to reduce downside capture to approximately 46% by addressing the extreme left tail.
Figure 3: Low Volatility’s Achilles heel
Problems loading this infographic? - Please click here
Source: Man Numeric calculations using Bloomberg and MSCI data from 1 May 2006 to 31 August 2025.
Quality strategies face different challenges. They rely heavily on balance sheet metrics like return-on-equity and debt levels. While useful as a foundation for identifying strong quality balance sheets, these metrics overlook broader definitions of Quality that can draw from other asset classes or newer concepts like environmental, social and governance (ESG) integration. This narrow approach can limit performance in rising markets. In addition, the raw form of Quality frequently leads to undesirable biases, including anti-growth positioning. Adjusting for these biases reveals the potential for significantly improved performance.
The improvements are measurable across strategies. When we adjust for the different levels of beta exposure to isolate their true alpha performance, these targeted defensive strategies deliver stronger information ratios (IR) (or risk-adjusted returns), reduced drawdowns, and better performance during the worst market periods.
Figure 4: Performance comparison of targeted versus traditional strategies

Source: Man Numeric calculations using Bloomberg, Refinitiv, Trucost, Worldscope/Compustat and MSCI data from 1 May 2006 to 31 August 2025.
Strategy evolution in a downturn
Timing matters just as much as strategy selection. The economic drivers behind a downturn often determine which defensive strategies perform well initially. Predicting which parts of the market will struggle most at the onset of a crisis is rarely straightforward, but we observe persistent performance patterns as events unfold:
- During the April 2025 downturn, Low-Volatility strategies performed well because their sector and industry exposures were less affected by the initial impacts of tariffs
- By contrast, Quality strategies were less effective in April 2025, but were well-positioned going into the market stress sparked by COVID in 2020
Our analysis of all major downturns since 2005 reveals consistent patterns. When ranking the performance of the three key strategies (Low-Volatility, Large-Cap, and Quality), along with their more refined versions, several trends emerge:
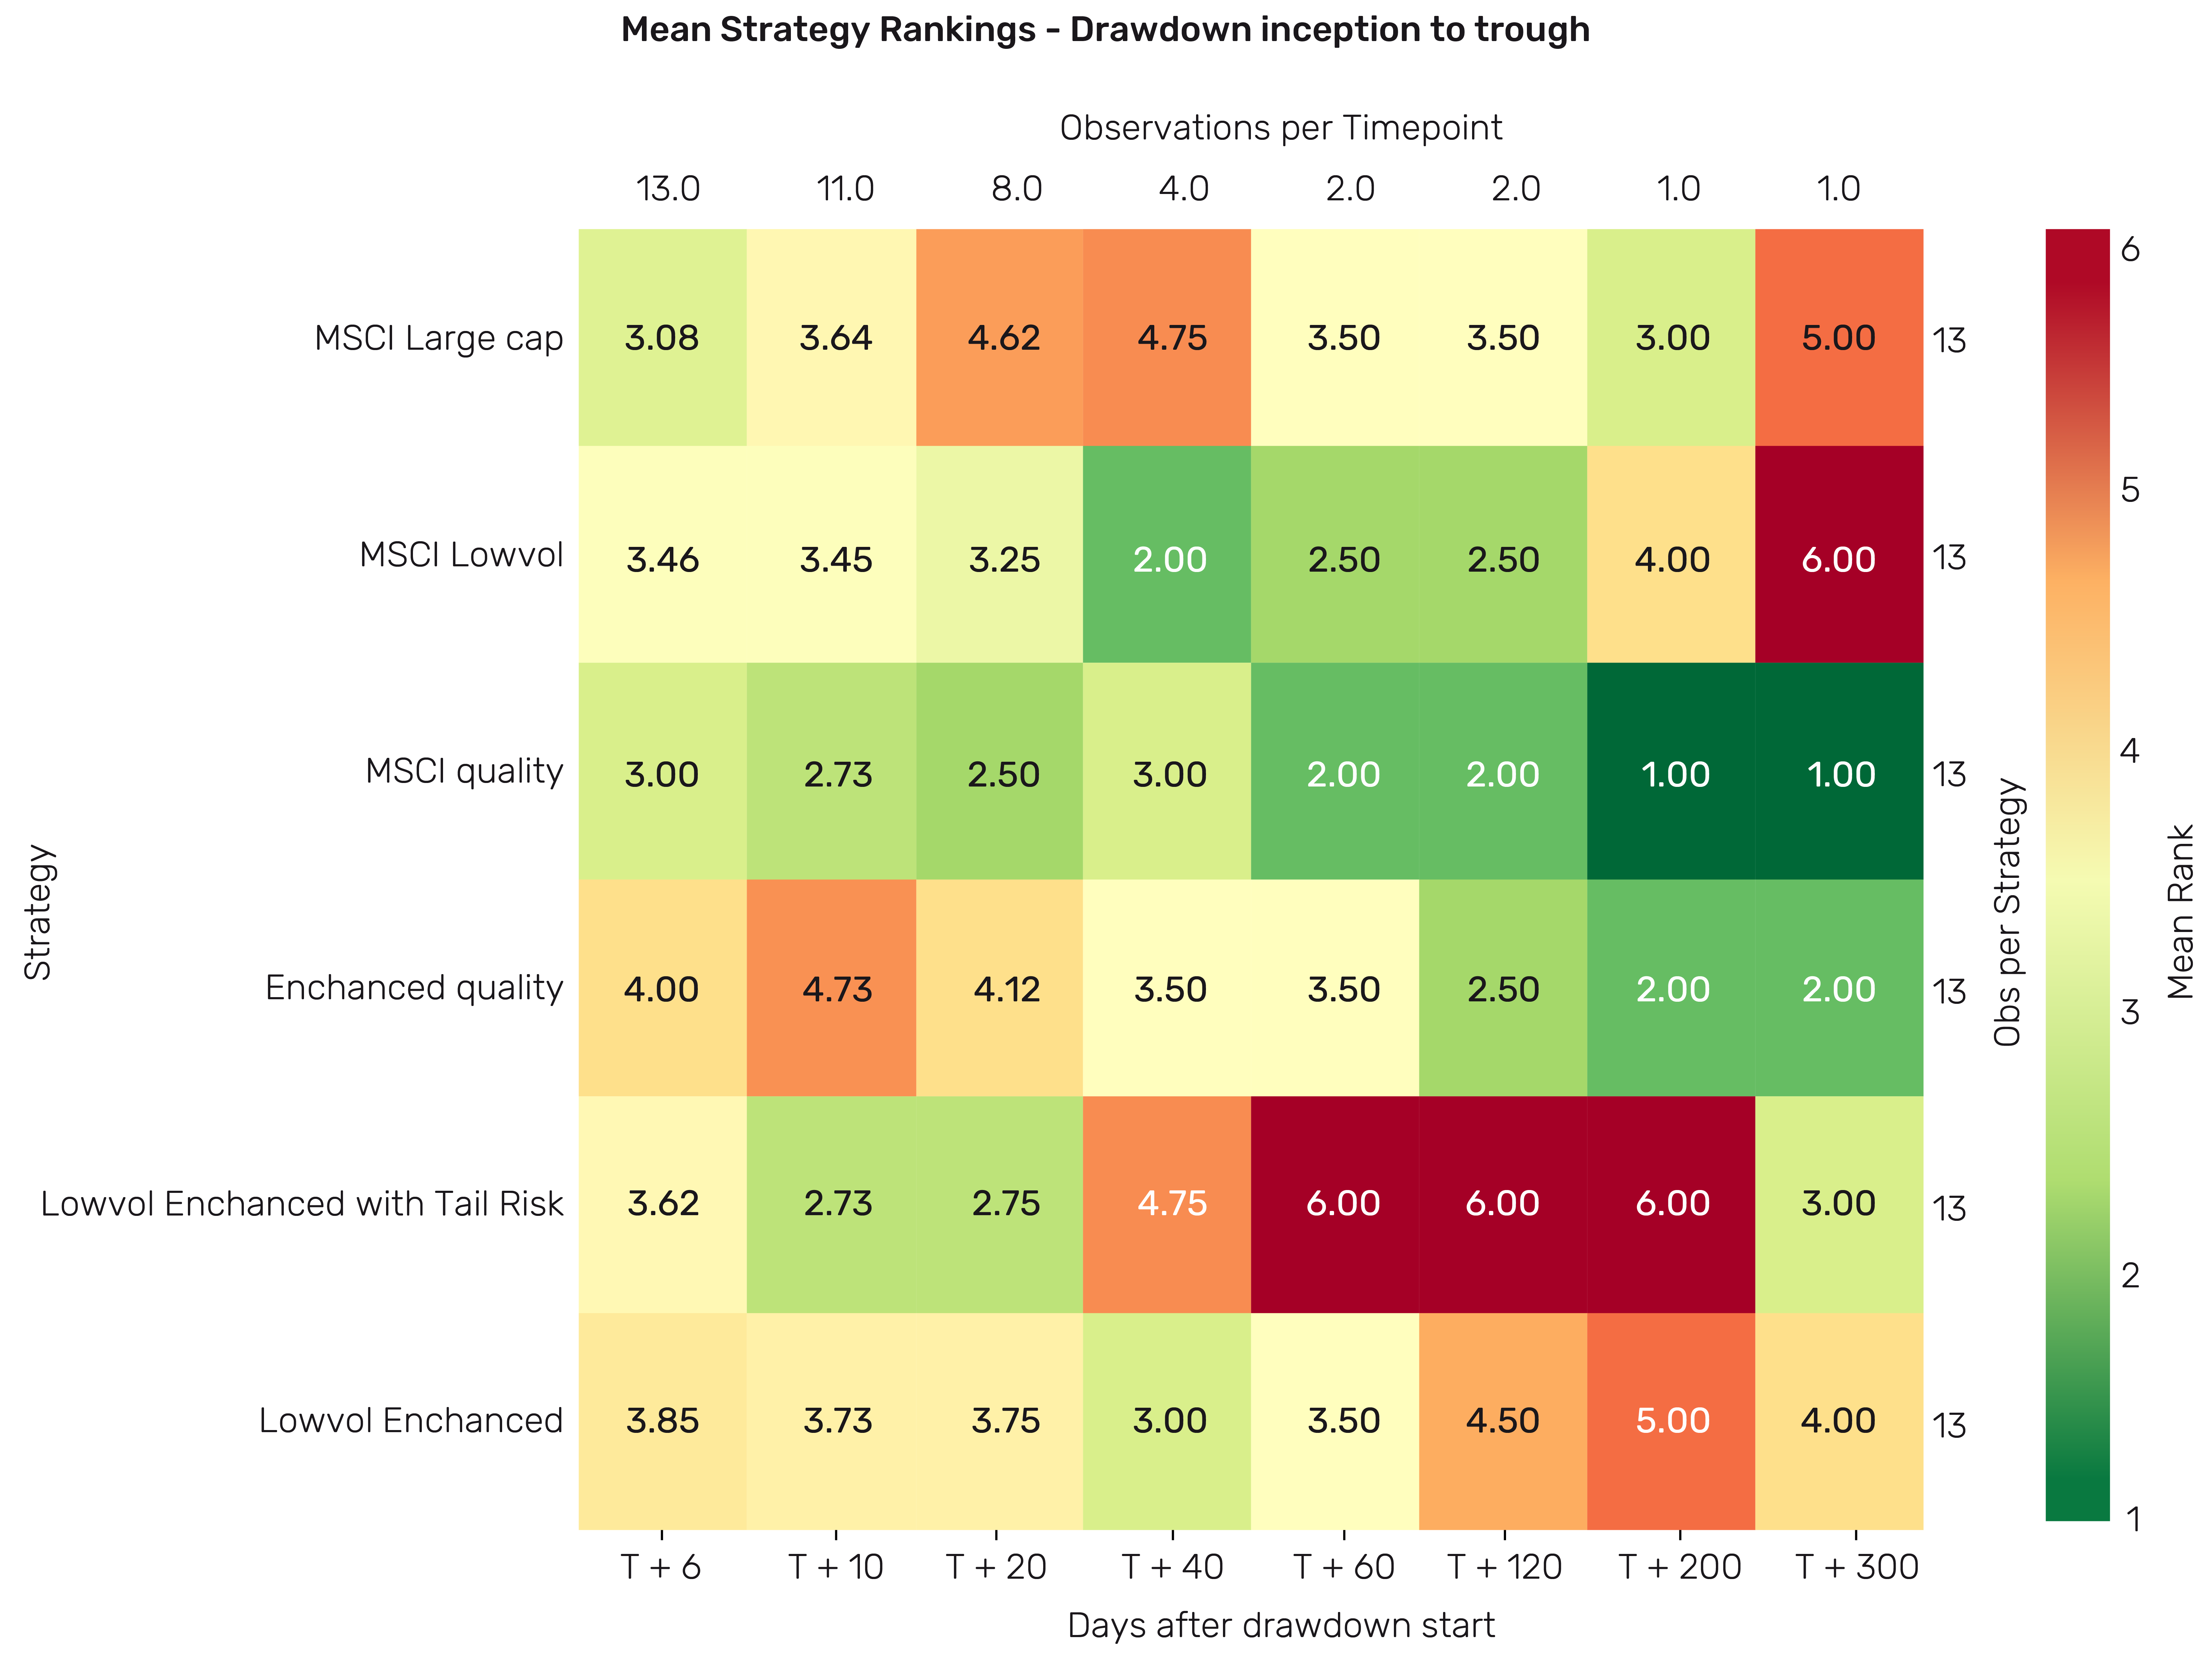
- Raw Quality strategies tend to take longer to outperform, averaging around 40 days to show their defensive benefits during the period of this analysis, and start to lead around two to three months into the downturn
- Large-Cap strategies generally deteriorate throughout the drawdown and are the consistent underperformer
- In the first five days of a crisis, it’s nearly impossible to predict which defensive strategy will perform best, as markets are still trying to understand the event
- Tail-risk managed Low-Volatility strategies shift the outperformance profile to earlier in the drawdown, particularly during the first 10-20 days, when volatility is highest. Tail risk management is most effective in these early stages, delivering significant savings
Figure 5 illustrates the trends from drawdown inception to trough, highlighting timing differences in performance across strategies. It is important to note that while the progression of drawdowns may show similarities across strategies, the broader market environment (including bull markets and sharp daily losses) ultimately demonstrates the value of reducing biases and addressing tail risks. These adjustments enhance the full risk-return profile of defensive strategies demonstrated in Figure 4.
Figure 5: From drawdown inception to trough
Source: Man Numeric calculations using Bloomberg, Refinitiv, Trucost, Worldscope/Compustat and MSCI data from 1 May 2006 to 31 August 2025.
Beyond Quality: other defensive alpha signals
While Quality alpha measures such as Profitability, Investment Quality and Earnings Quality are popular in the field, some traditional factors within the value and momentum families also deliver positive returns in down markets. Among these, stronger signals produce returns of over 1% during down months, compared to an average market decline of approximately 3%, as shown in Figure 6.
Even so, while Barra momentum offers protection during drawdowns, it has the weakest performance in rising markets given the biases inherent in its raw signal. This reflects momentum’s naturally higher volatility and sharper drawdowns, with a maximum drawdown of approximately 48% over the past 20 years.
By diversifying across momentum approaches, such as group and network momentum (two ways Man Numeric identifies trends in its proprietary momentum model), and removing unwanted biases from the signal, it is possible to capture significant downside savings and reduce drag in up markets.
Figure 6: Individual defensive factor performance in up and down markets
Problems loading this infographic? - Please click here
Source: Man Numeric calculations using Bloomberg, Refinitiv, Trucost, Worldscope/Compustat and MSCI Barra data from 1 May 2006 to 31 August 2025.
Alpha signals vary in their efficacy, with adjusted Momentum delivering the highest annualised returns. More Quality-oriented signals, such as dividend Yield, Profitability, and Cyclical Quality, produce annualised returns of around 2-3%. However, these signals differ significantly in the shape of their alpha production. Dividend Yield, Profitability, and Cyclical Quality tend to experience longer and shallower periods of underperformance, whereas balance sheet metrics like debt exhibit shorter but sharper drawdowns.
Beyond maximum drawdown and downside return
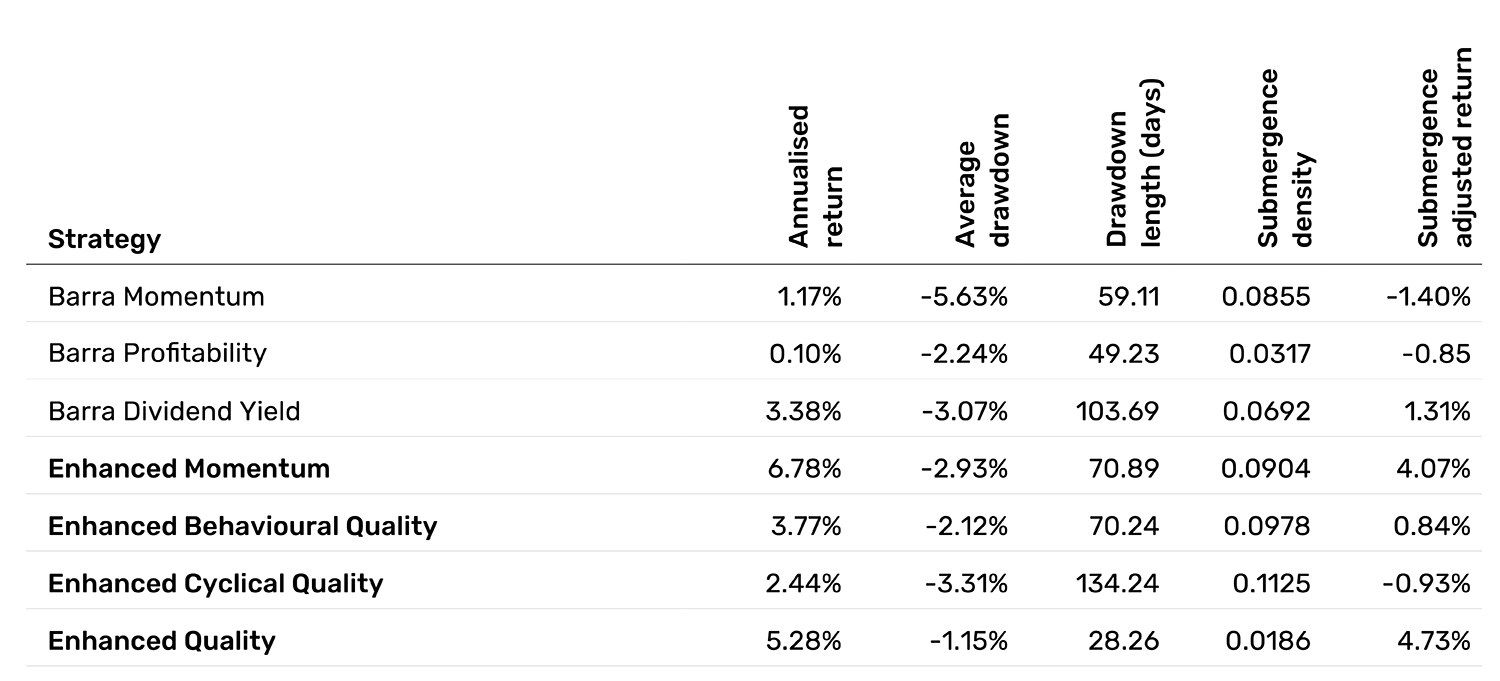
Traditional measures tell only part of the story. Maximum drawdown is often used as a key metric for analysing portfolio performance during a downturn but only shows the single worst loss. To further analyse these alpha concepts, investors need to understand how long strategies take to recover and how often they underperform, demonstrating a clearer understanding of a strategy’s resilience.
Our analysis uses additional measures, including submergence density, which provide a more complete view of downside risk. Submergence density captures both the severity and duration of losses by measuring the area under the curve of drawdown. This metric helps identify strategies that recover more quickly and spend less time under water.
Enhanced Behavioural Quality and profitability spend the least time in drawdown, producing more stable returns compared to enhanced Cyclical Quality2 and Dividend Yield, which experience longer recovery periods.
When adjusting for the relative time spent under water, submergence-adjusted returns provide a clearer view of strategy ranking. Under this framework, the benefits of Barra momentum and Cyclical Quality become less favourable. That said, while these signals may be less effective on their own, they can still add value when combined with other metrics to create a holistic view of quality companies.
Figure 7: Recovery time matters
Source: Man Numeric calculations using Bloomberg, Refinitiv, Trucost, Worldscope/Compustat and MSCI Barra data from 1 May 2006 to 31 August 2025.
Stress testing Low-Volatility through simulation
Extended equity drawdowns have been relatively infrequent over the past 20 years, giving us limited real-world data to test defensive strategies. To better understand how Low-Volatility strategies in particular might perform in prolonged periods of market stress, we use Monte Carlo simulations which create hundreds of different possible market scenarios based on historical patterns.
These simulations preserve how stocks actually behave, including extreme movements and how they move together, allowing us to test the resilience of Low-Volatility strategies under reconstructed market conditions.
We focus on Low-Volatility strategies because simulating Quality strategies is more challenging given their reliance on balance sheet attributes, which are difficult to model statistically.
Return generation process:
- Returns are generated yearly, using a t-distribution that matches individual stock risk, return, and tail properties
- The returns are adjusted to reflect the correlation structure of the market for the corresponding year
- Only the set of returns that simulate market dynamics consistent with a cap-weighted benchmark, matching risk, return, and tail profiles, are retained. This ensures the reconstructed history more closely reflects live market behaviour
- Certain assumptions in this process are less realistic, such as survivorship bias. Stocks are kept in the analysis regardless of their cumulative returns, even if they are very low or negative
Figure 8: Monte Carlo simulated market scenarios

Source: Man Numeric calculations using Refinitiv, S&P and Bloomberg data.
Creating the Low-Volatility portfolio involves the following steps:
- Construct a relationship (covariance) matrix annually using the generated returns, with smoothing applied to improve stability
- Optimise for the lowest variance portfolio utilising this relationship matrix between the stocks
- The resulting portfolio weights are used to construct the portfolio for the following year
For a Low-Volatility portfolio to generate positive results, the market would need to reward less volatile stocks more than financial theory in the capital asset pricing model (CAPM). An analysis of S&P 500 stocks over the past 20 years, excluding the top and bottom 5%, reveals a slope of -0.0095, indicating a slight tendency for lower-risk stocks to deliver similar returns than higher-risk stocks.
The simulated markets show similar patterns to the real markets in terms of rewarding Low-Volatility portfolios.
The regenerated Low-Volatility portfolios demonstrate improved volatility-adjusted maximum drawdown, with 94% showing lower maximum drawdown compared to their market counterparts. On average, these portfolios save 13% in drawdown. These results align with our findings from live market history. However, they tend to exhibit weaker information ratios (IRs) and similar levels of average return in their tails (expected shortfall) when compared to the broader market.
Figure 9: Improved drawdown and worse IR of regenerated low volatility portfolios
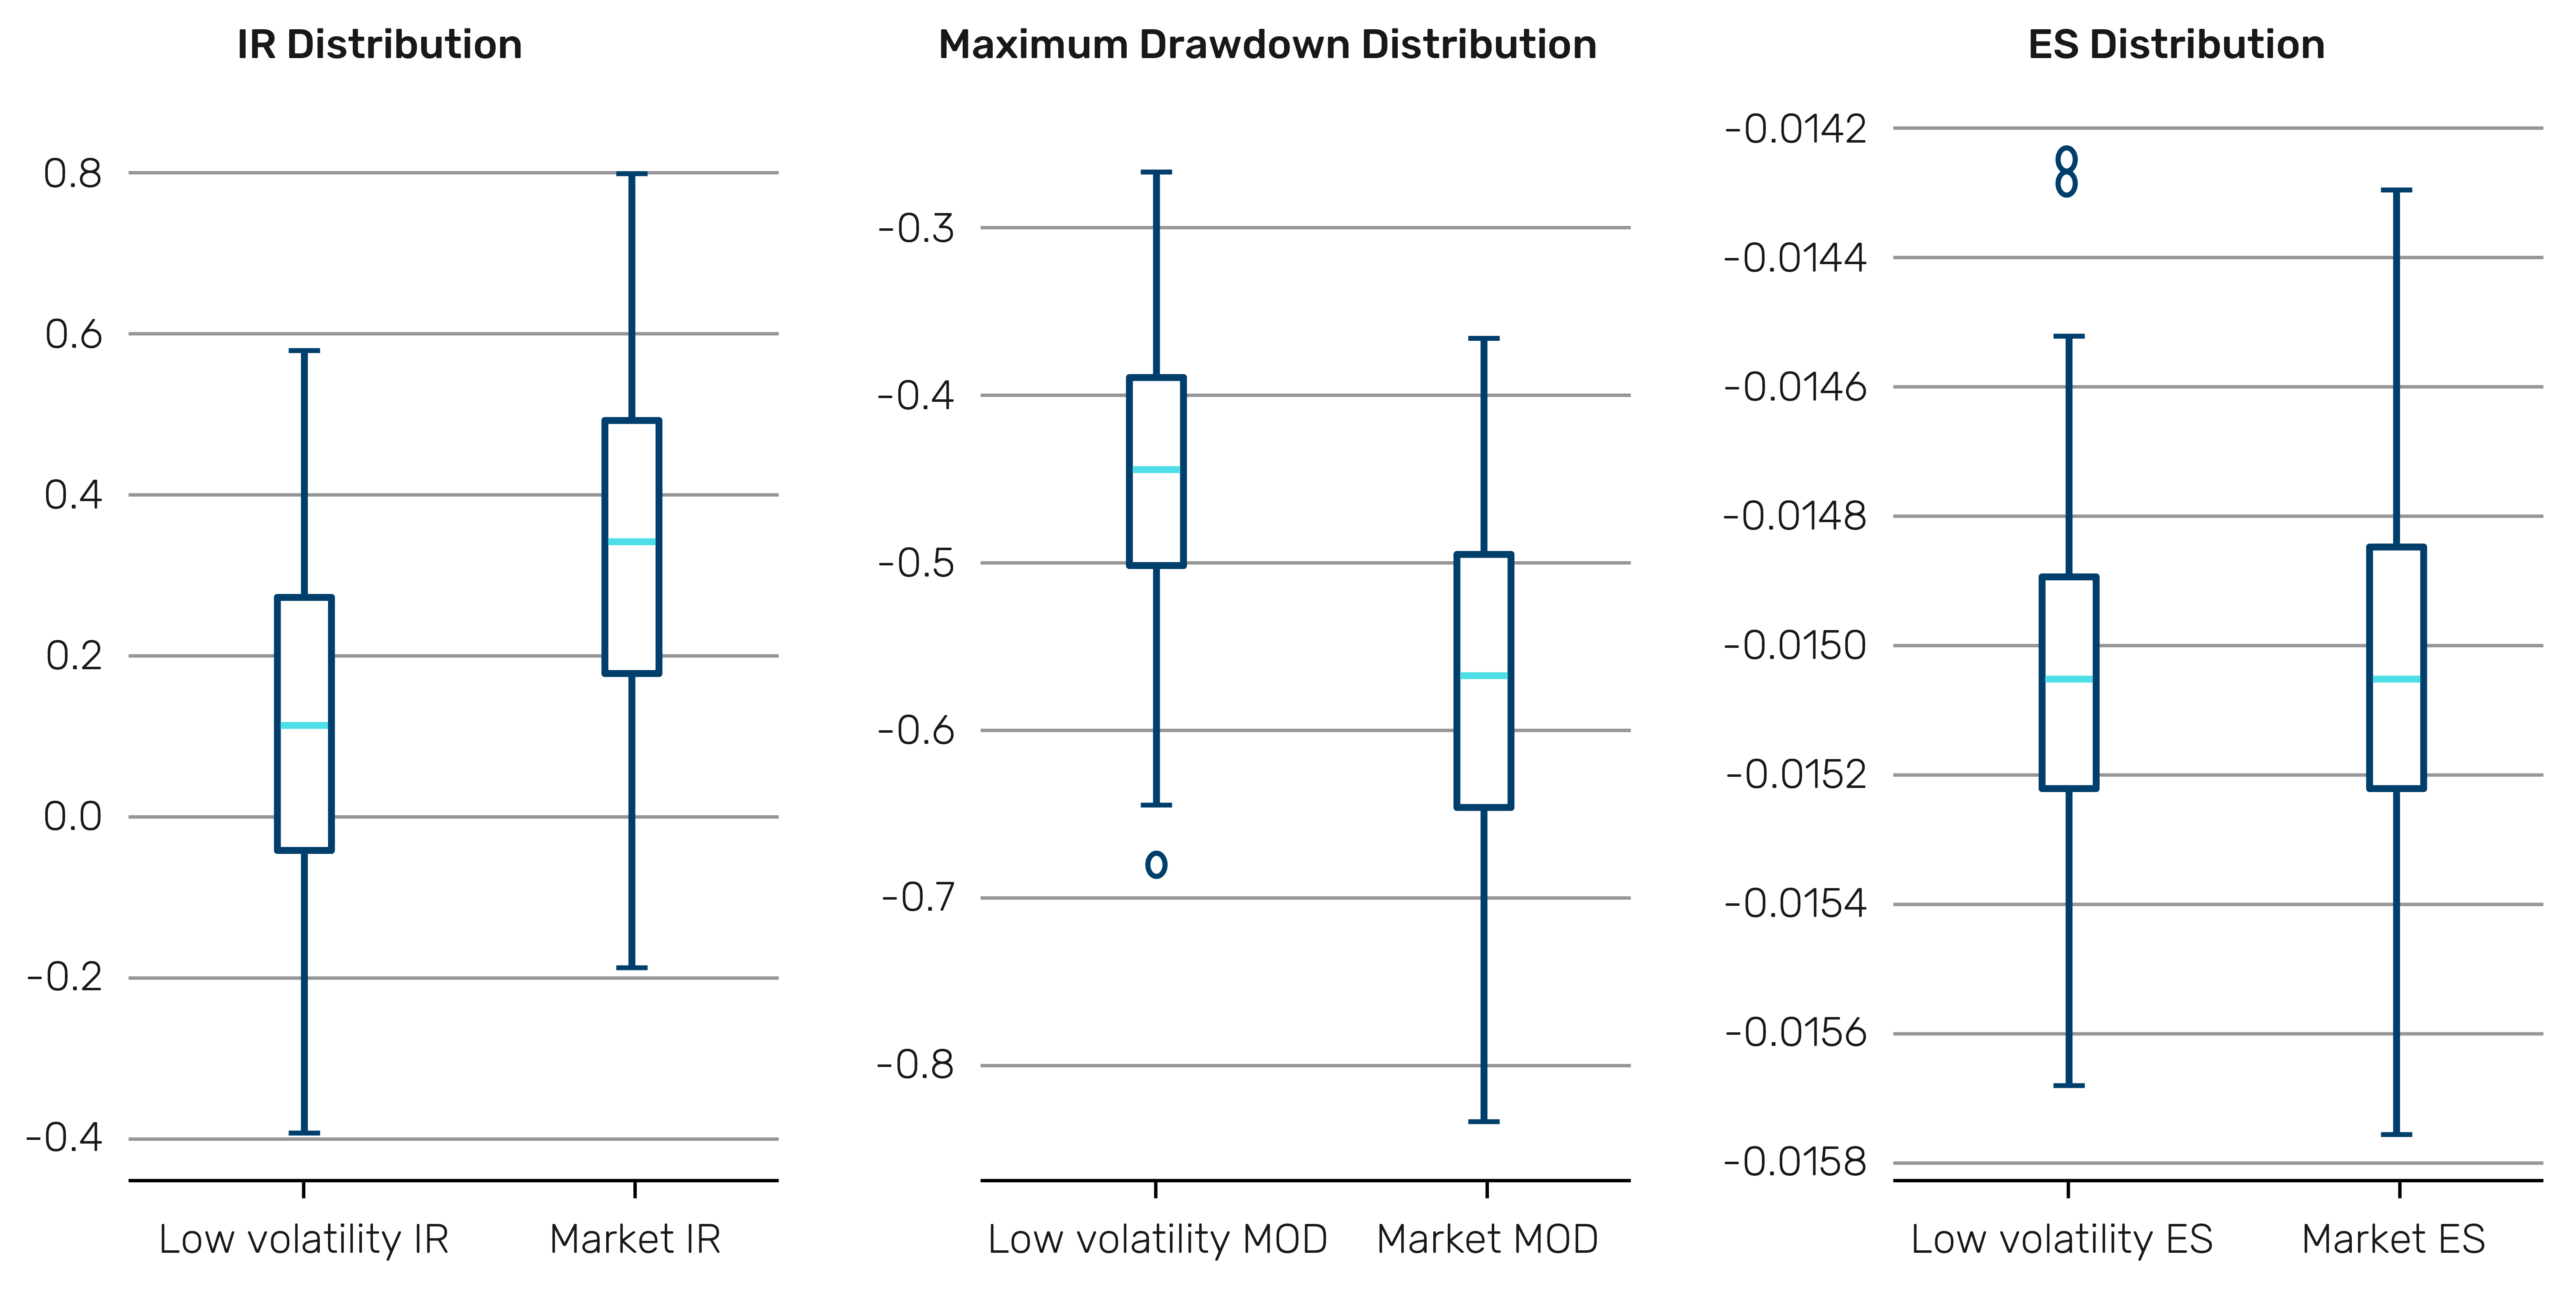
Source: Man Numeric calculations, using Refinitiv, S&P and Bloomberg data, as of 30 April 2025.
While these return streams attempt to reflect the key characteristics of the live marketplace, simulations have limitations. They capture how stocks typically move, but they struggle to replicate the psychological factors that drive real markets. The more realistic we make simulations, the less they help us test truly different scenarios. This creates a trade-off: realistic simulations versus testing a wide range of possibilities. Therefore, simulation results should always be viewed as one piece of the puzzle rather than a definitive take-away.
Conclusion
In an environment featuring tariff-driven volatility, geopolitical tensions, and extended market cycles, understanding the effectiveness of different defensive equity strategies is perhaps more important than ever.
Our research highlights the complexity of nuanced implementations of different defensive approaches and varying performance across market conditions.
Our analysis also shows that traditional defensive approaches each have specific limitations. However, risk-adjusted or more targeted versions of these strategies show potential for improvement.
Tail-risk managed Low-Volatility approaches can reduce downside capture by addressing extreme risks. Monte Carlo simulations show that 94% of the regenerated portfolios demonstrated better volatility-adjusted drawdowns, adding confidence to the defensive claims of Low-Volatility portfolios.
Quality strategies can be improved by adjusting for biases that lead to anti-growth positioning and improving their upside performance through additional alpha concepts.
Predicting which defensive strategies will perform best at the onset of a crisis remains difficult, as early performance depends on specific economic triggers – whether tariffs, pandemics, or broader market disruptions.
Ultimately, the strength of defensive equity investing lies in diversification. Combining risk-based and alpha-driven approaches reduces exposure to specific biases and improves long-term portfolio stability. Investors who balance these strategies thoughtfully will be better equipped to navigate the challenges of evolving market cycles.
Notes: Barra, LLC's analytics and data (www.msci.com) were used in the preparation of this report. Copyright 2025 Barra, LLC. All Rights Reserved.
1. Rook, Dane and Golosovker, Dan and Monk, Ashby, Submergence = Drawdown Plus Recovery (February 3, 2023). Available at SSRN: https://ssrn.com/abstract=4346463 or http://dx.doi.org/10.2139/ssrn.4346463
2. Enhanced Behavioural Quality and enhanced Cyclical Quality are proprietary Numeric alpha models.
You are now leaving Man Group’s website
You are leaving Man Group’s website and entering a third-party website that is not controlled, maintained, or monitored by Man Group. Man Group is not responsible for the content or availability of the third-party website. By leaving Man Group’s website, you will be subject to the third-party website’s terms, policies and/or notices, including those related to privacy and security, as applicable.