Introduction
April’s equity market gyrations came as a bit of a shock after some otherwise solid returns for the asset class year-to-date. What surprised many investors was how resilient trend-following strategies were over the month, despite being long equities, long beta to equities, and having much of 2024’s gains generated by equities. In this article, we take the opportunity to explain why this occurred and we try to dispel some of the mysteries surrounding trend-followers’ performance in the process.
What’s not to like?
Trend-following strategies have performed as well as equities in the long run, yet are uncorrelated to them, and work particularly well when equities don’t.
As we have outlined in previous papers, trend-following strategies have performed as well as equities in the long run, yet are uncorrelated to them, and work particularly well when equities don’t. Institutional investors typically have an allocation to trend-following given its complementarity to traditional investments.
The inclusion of trend-following strategies in the portfolios of smaller investors is less common. In our experience this is not because those we speak to aren’t aware of them, but more to do with how difficult it can be to communicate a trend-follower’s performance, be it to investment committees or to end investors.
Why might this be?
April 2024 gave us some unique insights to help answer this question, but first we will touch on how trend-following strategies work. In some sense trend-following is naively simple. Buy what’s going up, sell what’s going down, and diversify across tens if not hundreds of different markets in order to capture trends wherever and whenever they occur. To counter the knee-jerk response of nay-sayers, this is not a ‘black box’ strategy. It is a transparent box that is researched by humans but implemented via computers which aren’t subject to the investor’s Achilles heel – emotion.
April’s insights
Trend-following is a transparent box that is researched by humans but implemented via computers which aren’t subject to the investor’s Achilles heel – emotion.
So the strategy takes long and short positions across asset classes, which intuitively gives rise to its ‘uncorrelated to equities’ property. But this isn’t satisfactory when trying to understand performance. How can we frame performance in the investment world we know, the world we read about in the Wall Street Journal or Financial Times where, more-often-than-not, it’s equities that makes the news headlines?
The higher-than-expected US inflation print on 10 April set the tone for a weak remainder of the month for equity markets. The S&P 500 Index lost 4.1% and the supposedly balanced global ‘60/40’ equity/bond portfolio lost 2.5% during the month. Trend-following, on the other hand, returned 1.7% and 1.5% for the two industry barometers we follow closely, namely the Barclay BTOP50 and Société Générale Trend Index, respectively1. This is despite trend-following’s long exposure to equities, long beta to equities, and most of 2024’s profits attributable to said long equities positions.
Problems loading this infographic? - Please click here
How can we understand why a strategy that’s long equities profits while equities are down?
A trend-follower’s beta to equities can originate from a number of positions that are held.
We can do this by looking at the sensitivity of the strategy to various market factors, or ‘beta’. The first thing to note is that a trend-follower’s beta to equities, say, can originate from a number of positions that are held. Other than equities themselves, long credit and long EM FX positions can analogously be regarded as long risk assets so might behave similarly to equities in general. Additionally, short USD and short bonds might profit in equity sell-offs, so there is a relationship to equities there too. These relationships are less direct, of course, and somewhat dependent on prevailing correlations.
By extension, a trend-follower also has betas to the US dollar, bonds, etc. We show the time dependence of these in Figure 2 below, for a representative trend-following programme trading around 100 global futures markets and targeting about the same volatility as equities over the long term.
Figure 2. Beta, or sensitivity to a one standard deviation move in the underlying, of a trend-following programme trading approximately 100 global futures markets across asset classes, targeting equity-like volatility
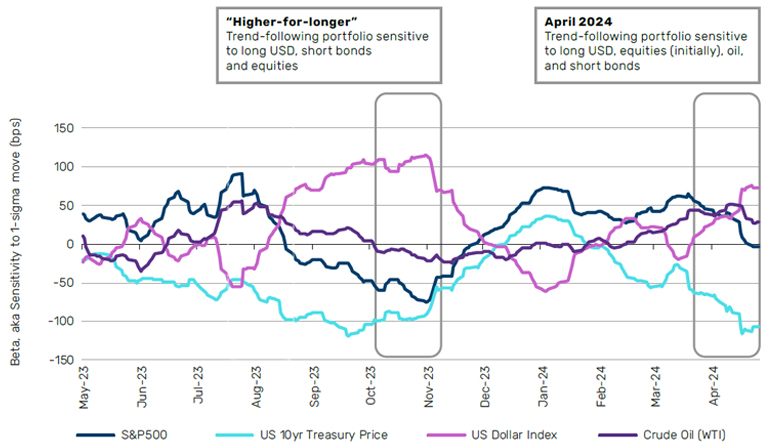
Source: Man Group database, as at 30 April 2024.
Note, first of all, how betas vary a great deal. In October 2023, the “higher-for-longer” market narrative was in full flow. This was bad for bonds, bad for stocks, and good for the US dollar. Trend-following strategies were positioned to reflect these trends and were able to profit from down-moves in bonds and stocks and up-moves in the US dollar. After better-than-expected inflation numbers in November, however, this market narrative changed and, as we entered 2024 expecting six rate cuts from the US Federal Reserve, betas switched; it was now predicted to be profitable when stocks and bonds rose, and the US dollar fell.
Second, note how the dominant beta changes over time. At the start of 2024, equities was the largest beta. At the end of April, however, the sensitivity to moves in US Treasuries is most significant, outpacing equities by far.
How does this relate to April’s resilient performance of trend-following strategies?
Well, yes, equities have been weak, and trend-following strategies have made losses there, but bonds have fallen and the USD has risen, resulting in profits. Further, as Figure 2 shows, bond and USD positioning was at least of similar significance to the strategy in April.
Conclusion
We can’t just look at equity performance and the beta to equities. Trend-followers trade all asset classes, and positions can be short or long.
While trend-followers stumbled in early May as markets exhibited the strategy’s Achilles heel – a sharp reversal in the preceding drivers of performance – as at the time of writing, trend-followers have mostly recouped these losses as the previous trends resumed. This is perhaps further evidence that we can’t just look at equity performance and the beta to equities. Trend-followers trade all asset classes, and positions can be short or long. We have to work that little bit harder, look at performance across asset classes, and weigh that alongside positioning. It’s not a black box, however, as this positioning is intuitive. Our key point is that there is no magic bullet to understanding a trend-follower’s performance.
Is it worth the extra effort? We’ll go back to our original observation that trend-following, through its long-term uncorrelated track record and resilience in weak market environments, is an attractive component of a portfolio, particularly alongside traditional asset classes. We only need to go back to 2022 to see this. The S&P 500 lost 19%, Barclay Capital Global Aggregate bonds lost 11%, while the BTOP50 and Société Générale Trend Index gained 15% and 27%, respectively2. Sure, to understand it requires some mental hard work but the results, in our view, are well worth it.
1. In total return terms.
2. Source: Bloomberg, Société Générale and BarclayHedge.
You are now leaving Man Group’s website
You are leaving Man Group’s website and entering a third-party website that is not controlled, maintained, or monitored by Man Group. Man Group is not responsible for the content or availability of the third-party website. By leaving Man Group’s website, you will be subject to the third-party website’s terms, policies and/or notices, including those related to privacy and security, as applicable.