Key takeaways:
- Cat bond returns have been positive every year since 2002 except one, with double digit returns in the last three years. They have exhibited equity-like returns with bond-like volatility1
- Returns have low correlation to those of equities and bonds, making cat bonds an excellent diversifier. This effect exists in the tails as well: financial crashes do not cause natural catastrophes
- So where’s the catch? This paper tackles five questions that investors ought to be asking
Catastrophe (cat) bonds are insurance-linked securities that transfer specified event risks, such as hurricanes or earthquakes, from insurers and reinsurers (sponsors) to investors. These bonds provide sponsors with efficient access to the capital markets, while simultaneously providing investors with an attractive and diversifying source of return.
The first cat bonds were launched in the 1990s, and the asset class has matured over time with the introduction of regular broker marks and the launch of the market-capitalisation-weighted Swiss Re indices in January 2002. Annual returns for these indices have been positive in every year since 2002 except one, with double-digit returns in each of the last three years.
The realised annual return of cat bonds (7.7% since 2002) is comparable to that of stocks (8.7%) over the same period. By contrast, annualised volatility (based on monthly returns) is 3.5%, much lower than stocks’ 15.1% and closer to the 3.3% recorded for world bonds (although bond performance over this period has been more modest, at 3.5% per annum).2
Simply put, cat bonds have exhibited 'equity-like returns with bond-like volatility' and can be viewed as an attractive investment both on a standalone basis and as part of a broader portfolio.
Having previously explored the growing cat bond market and cat bonds’ dual role in providing stable returns and supporting global risk management initiatives, we now move beyond introductory definitions to ask the hard questions.
1. Why have drawdowns been so limited, and will that hold?
As shown in Table 1, the maximum drawdown experienced by the cat bond index (since inception in January 2002) has been both shallower and shorter than for stocks and bonds.
However, this period has not been without major natural disasters, notably Hurricane Katrina (2005); the Tōhoku earthquake and tsunami (2011); Hurricanes Sandy (2012), Harvey/Irma/Maria (2017) and Ian (2022); and the LA Wildfires (2025). It’s not that cat bonds were unaffected by these events, but rather that they demonstrated diversification across peril, geography, seniority and trigger. This is a robust and battle-tested performance.
Table 1: Cat bond drawdowns have been shorter and shallower than for stocks and bonds
Source: Bloomberg. Date range: January 2002 to October 2026. Indices: Cat bond index - Swiss Re Global Cat Bond Total Return Index hedged to USD; World stocks - MSCI World Net Total Return Index hedged to USD; World bonds - Bloomberg Global-Aggregate Total Return Index Value Hedged to USD; High yield - ICE BofA Global High Yield Index.
Problems loading this infographic? - Please click here
The exception to the pattern of positive annual returns was in 2022, when the Swiss Re Index declined by 2.15%.3 Hurricane Ian was the main contributor. Its impact was amplified by the storm’s landfall in a densely populated area, while losses over the year were compounded by secondary perils, including floods and hailstorms. However, this annual decline marks an exception rather than the norm.
Several factors help explain this:
- Dedicated reinsurance capital stands at around USD750 billion.4 Assuming no more than 10% of that capital is exposed to any single peril, a large event could materially reduce the capital available to write new business against that peril. This can harden the market, increasing the premiums demanded and expected returns on new business. Hurricane Ian in 2022 provides one example, as do Hurricanes Harvey, Irma and Maria in 2017
- While equity and bond prices are sentiment driven, cat bonds are less so. After a significant macro event, such as the Global Financial Crisis (GFC) or the COVID pandemic, sentiment can take time to recover. Cat bond returns, by contrast, tend to be driven more by income earned over time and by whether qualifying catastrophic events occur
- The payout on a cat bond is not always linked to a single event. In aggregate deals, it depends on the combined losses from qualifying events throughout a risk period. This distinction was relevant to the Los Angeles wildfires. Although wildfire losses contributed to the aggregate loss of certain bonds, a subsequent benign Atlantic hurricane season meant that the aggregate limit was not necessarily breached. In other words, even in a single deal, the wildfire losses were 'diversified away' by reduced losses from other qualifying events
- A well-diversified cat bond portfolio may only hold one or two deals exposed to smaller perils. In a portfolio of 100 equally weighted holdings, a triggering event may only result in a 1-2% loss. If the portfolio has a net expected annual return of 8%, such losses could be absorbed within a few months. Even for peak perils, to which more bonds are likely to be exposed, differences in geographical exposure, seniority, trigger type (such as an indemnity or industry index) and recovery basis (occurrence, aggregate) offer additional diversification
The bottom line: Recovery from drawdowns is supported by diversification across perils, income-driven returns, and post-event hardening. These mechanisms are structural and therefore we expect them to persist.
2. Will the low correlation with equities and bonds continue?
Much is made of the low correlation between cat bonds and equities or conventional bonds. Table 2 illustrates why this is appealing, but it fails to capture two key points.
Table 2: Low correlation between cat bond returns and other asset returns
Source: Man Group database, Swiss Re, MSCI, and Bloomberg. Date range: January 2002 to October 2026. Indices: Cat bond index - Swiss Re Global Cat Bond Total Return Index hedged to USD; World stocks - MSCI World Net Total Return Index hedged to USD; World bonds - Bloomberg Global-Aggregate Total Return Index Value Hedged to USD; High Yield - ICE BofA Global High Yield Index.
Problems loading this infographic? - Please click here
Firstly, cat bonds are triggered when a hurricane makes landfall, an earthquake strikes, or urban areas flood. They are not triggered by turmoil in financial markets. In other words, the low correlation between cat bonds and traditional assets has a structural basis. By contrast, bond-equity correlation can fluctuate depending on the nature of the shock. An inflationary shock tends to induce positive correlation, whereas a growth/demand shock tends to induce negative correlation. Stock-bond correlation was predominantly positive before 2000, subsequently turned negative, and reverted to positive in 2022.5 In short, stock–bond correlation is regime-dependent.
Secondly, correlation matters less when asset-price movements are small and matters most during tail events. Do portfolio assets all suffer losses at the same time, or do some behave differently and provide diversification when it is most needed? Given equities typically form a large portion of an investor’s holdings, the real question is: “when equities are having a bad day, what is everything else doing?”
Figure 1 (bottom) helps to answer that question. At each probability threshold on the horizontal axis, it shows the average weekly returns of other indices during the MSCI World Index’s worst weeks. As equity sell-offs deepen, high-yield credit declines alongside equities, failing to offer diversification just when it is needed. By contrast, the average return of the Swiss Re Cat Bond Index remains close to zero, illustrating little tail dependence on equities. Figure 1 (top) shows the same pattern over time: during the GFC in 2008, the COVID crash in 2020 and the 2022 rate-hiking cycle, equities sneezed and credit caught a cold. Cat bonds barely sniffled.
Figure 1. Tail co-movement of credit and cat bonds with equities. A large equity selloff does not imply a large cat bond selloff
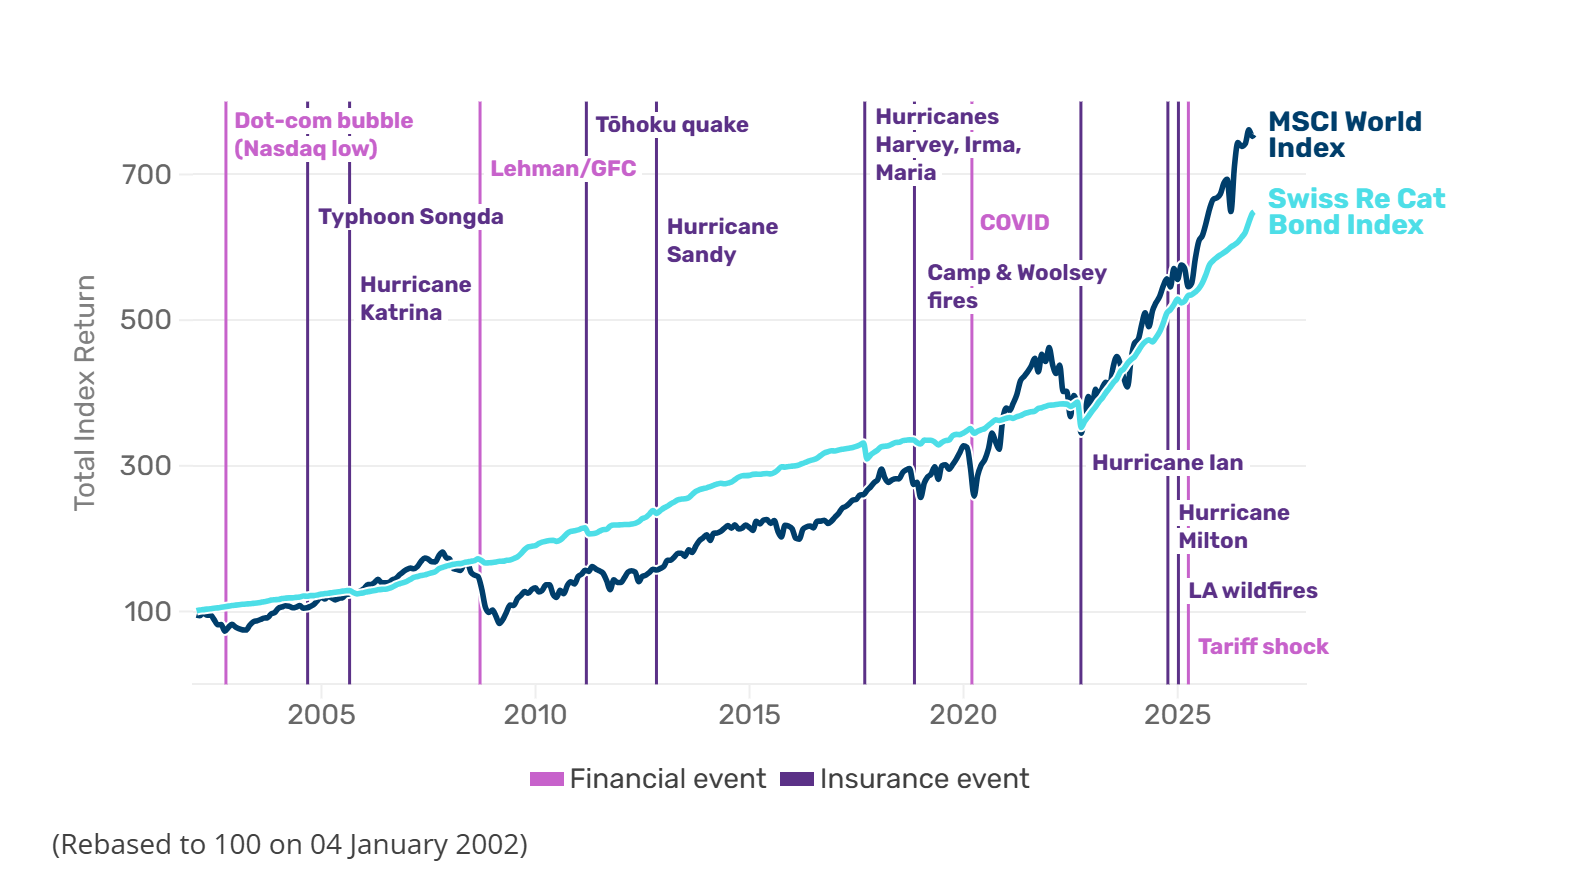
Source: Man Group database, Bloomberg. Date range: January 2002 to October 2026. Indices: Cat bond index - Swiss Re Global Cat Bond Total Return Index hedged to USD; World stocks - MSCI World Net Total Return Index hedged to USD; World bonds - Bloomberg Global-Aggregate Total Return Index Value Hedged to USD; High Yield - ICE BofA Global High Yield Index.
Problems loading this infographic? - Please click here
For a diversified portfolio, the prospect of a structurally uncorrelated return stream (along with tail independence) is an appealing prospect. Its diversification benefits could justify a lower Sharpe ratio threshold for inclusion than for a more correlated strategy.
The bottom line: Financial crises do not cause natural catastrophes. This origin of low correlation with financial assets matters because it gives comfort that diversification will be there when it matters – during tail events.
3. Why do sponsors pay for this protection?
We have so far established that cat bonds may be attractive for investors on a standalone basis and as part of a broader portfolio. That alone, however, is not sufficient to ensure that the market grows or that pricing remains fair to both sides. The buyers of insurance, or sponsors, must also have a reason to participate.
Private reinsurance capital has always been finite. Even today, the available pool is only around USD750 billion. If we assume exposure to any one peril is limited to 10% of that capital, then insuring single event losses greater than USD75 billion will be challenging.
The late 20th century brought substantial insurance and reinsurance losses, including those associated with Hurricane Andrew (1992), the Baltic Exchange bombing (1992) and Bishopsgate bombing (1993) in the UK, the Exxon Valdez oil spill (1989), the Piper Alpha disaster (1988), and asbestos-related claims. Pressure on capacity prompted reinsurers to access the capital markets through securitised insurance risk, including cat bonds.
Additional capacity is the obvious benefit for sponsors, but there are others:
- The introduction of greater pricing competition: cat bond investors may have a different perspective on risk (and, therefore, pricing). For example, to a traditional reinsurer, Florida wind is a concentrated peril; to the capital markets, it is a diversifier
- Counterparty credit exposure: unlike an insurance contract supported by margin, the sponsor of a cat bond has no counterparty exposure to the investor. Instead, the proceeds from the sale of a cat bond are held within the issuing special purpose entity (SPE) in money market funds
- Term of cover: while traditional reinsurance usually has a one-year term, cat bonds commonly have terms of around three years. Sponsors can therefore secure multi-year cover, and some deals permit early termination
- Competition considerations: sponsors may be reluctant to share detailed exposure data with potential competitors in the insurance market. By contrast, financial market investors generally do not compete for the same client business, reducing the risk of commercially sensitive data reaching underwriting rivals
Notwithstanding these benefits, some perils are better suited to securitisation than others:
- The process by which two or more events are aggregated and considered to be a single event needs to be sufficiently clear
- Losses need to be determined within a manageable period, so that bonds do not have to be extended for prolonged periods (e.g. pollution liability, product liability)
- There may be a reluctance to assume war-related risks if they have the potential to induce a correlation to other financial assets
- More generally, there needs to be sufficient confidence in the models used to assess the peril
The bottom line: The appeal of cat bonds for sponsors goes beyond additional capacity. They also support competitive pricing, limit counterparty exposure, and offer multi-year cover.
4. Can the market grow without compressing the premium?
Given the potential benefits of cat bonds for both investors and sponsors, we believe the market appears well placed to grow without distorting the market price of risk.
Since 2002, the market’s capitalisation has grown from around USD0.5 billion to USD63 billion (Figure 2, top).6 Despite a four-year pause following the GFC, the market has grown steadily at about 23% per year. 2025 was a record year for issuance, and 2026 appears to be heading in the same direction (Figure 2, bottom).
Figure 2: Growth of cat bonds’ market cap and annual issuance
Source: Man Group database. Date range: January 2002 – October 2026.
Problems loading this infographic? - Please click here
Problems loading this infographic? - Please click here
While growth has been impressive, cat bonds remain a much smaller market than many traditional financial assets, such as the US high-yield bond market which exceeds USD1 trillion.7 Provided cat bonds remain an attractive proposition, and as investor awareness and understanding develops, demand for these assets should continue to grow.
Potential sources of increased supply include:
- Climate change: all else being equal, climate change is likely to increase global insured losses. If insurer capital remains constant, more risk will need to be ceded to reinsurers (and on to cat bonds)
- Inflation and urbanisation: for any given event, the effects of inflation and urbanisation can increase insured losses, pushing up the amount of risk that needs to be ceded by insurers
- Novel perils: the “peak perils” of US hurricanes and earthquakes may have helped establish the cat bond market, but the traditional insurance market also faces other risks, notably cyber and terrorism.
Terrorism cover is supported by a range of national schemes and pools, including Pool Re in the UK, GAREAT in France and the Terrorism Risk Insurance Program (TRIP) in the US. These arrangements seek to manage terrorism risk and, in some cases, have used cat bonds to obtain additional protection.
The first terrorism-linked cat bond was launched in 2003. Golden Goal Finance provided cover in the event that the 2006 FIFA World Cup was cancelled, with terrorism among the risks contemplated. In 2019, Pool Re introduced pure UK terrorism cover to the market. GAREAT followed with French terrorism cover in 2024, and TRIP with US terrorism cover in 2026.
The first cyber cat bond deals, launched in 2023, were private, but these were closely followed by public deals later that year, and specialised cloud outage deals appeared in 2024.
In our view, cyber could eventually become a third “peak peril”. Although we expect it to remain smaller than hurricanes and earthquakes, it could provide a valuable source of capacity (for sponsors) and diversification (for investors). We don’t expect terrorism cat bonds to reach the same scale but, given there are around 14 terrorism pools globally,8 we expect further growth. - New sponsors: the market’s early adopters remain active. For example, Swiss Re has sponsored more than USD7 billion in notional value across more than 100 bonds over more than two decades. The United Services Automobile Association (USAA) has issued a comparable number of bonds over a similar period, but at an even larger notional value of more than USD11 billion. New sponsors continue to enter the market, attracted by competitive pricing, three-year cover, and additional capacity. Porch Group, Gothaer, One Alliance and PICC9 brought debut deals to market in 2026. The latter, a Chinese insurer, is particularly noteworthy because China’s National Financial Regulatory Administration (NFRA) has encouraged insurers and reinsurers to use Hong Kong as a domicile for cat bond issuance.10 That could support further sponsor activity from mainland China.
The bottom line: The cat bond market has scope for further growth, and maintaining current premiums. Investors should be selective on deals and supportive of new perils as they arise.
5. What risks are the hardest to price?
As any student of Grey’s Anatomy knows, risks need to be considered alongside potential benefits. So where might the pain points be for cat bonds?
Event history and model maturity
Earthquake data from the US Geological Survey (USGS) date back as far as 1638. However, the earliest records are historical accounts rather than instrument readings. The quality and coverage of seismic monitoring improved during the 20th century and the number of small earthquakes recorded each year has steadily increased. However, the recorded frequency of earthquakes of magnitude five or greater appears to have levelled off around 1975, suggesting approximately 50 years of clean data (Figure 3). As the USGS makes abundantly clear, earthquakes cannot be predicted,11 but historical data can help estimate their probabilities.
Figure 3. USGS earthquake events per year by magnitude threshold (1900-2025)
Source: Man Group database, USGS.
Problems loading this infographic? - Please click here
The National Oceanic and Atmospheric Administration’s (NOAA) Atlantic hurricane dataset begins in 1851, with storms being named since 1950. For continuous basin coverage, 1966 heralded the satellite era. A Bayesian change-point analysis of hurricane activity suggests an intensity jump around 1995. Consequently, even though the dataset spans roughly 175 years, including around 60 years of satellite-era observations, we may have only about 31 years of clean, directly relevant data.
The California wildfire record is also reasonably long, but the underlying risk has changed over time. For example, around eight of the 10 costliest wildfires occurred in the past decade.12
With man-made perils, such as terrorism and cyber, the data are sparser still. For example, there has been no payout under the US Terrorism Risk Insurance Act (TRIA, 2002); indeed, no event has even been certified under the Act by the US Treasury. Similarly, no historic cyber event has been of sufficient severity to trigger any publicly issued cyber deal.
In summary, established perils may have longer historical data than newer ones, but the amount of data relevant to today’s risk may be lower than first appears.
Catastrophe risk modelling firms, including Verisk (formerly AIR Worldwide) and Moody’s RMS, periodically update their models to reflect new data and changing assessments of risk. To the extent that these models incorporate expectations about near-term climate conditions, cat bonds are not simply an unconstrained ‘bet on climate change’. Instead, investors face model lag risk: the risk that the models used to price a bond do not keep pace with changes in the underlying risk.
Underpriced risks
From time to time, certain perils (e.g., severe convective storms) or bonds with parametric triggers (e.g., earthquake magnitude) are claimed to be underpriced. This means that the spread offered is considered too low for the risk. We are generally cautious about such claims. Cat bonds, by their nature, are designed to trigger infrequently, so a long and relevant history is needed to draw firm conclusions about event frequency. Moreover, an investor arguing that a new issue is underpriced must explain why its assessment of the risk differs from the price accepted in the market.
Investors who avoid risks they consider underpriced may benefit over the long term, but avoiding a single loss does not, by itself, demonstrate skill. Consider Hurricane Melissa in 2025, which triggered an International Bank for Reconstruction and Development (IBRD) bond providing parametric cover to Jamaica. If an investor avoided that bond because they considered its spread too low, should avoiding the resulting loss count as alpha? At a higher spread, the same investor might have bought the bond and incurred the loss. The point is that the principal reduction on a single deal is independent of the spread that was paid. It is the expectation of the two that matters, and that requires much more data.
Counterparty and other credit risks
The proceeds of a cat bond issue are typically held as collateral in the issuing special purpose entity (SPE). The SPE is hedged and thereby retains no insurance risk; there are no further claims on bondholders; and the sponsor’s exposure to the bond investor is nil. It does not, however, eliminate every credit or operational risk: both sponsor and investor may be exposed to the assets or arrangements used to hold the collateral.
Figure 4. Generic structure of an SPE
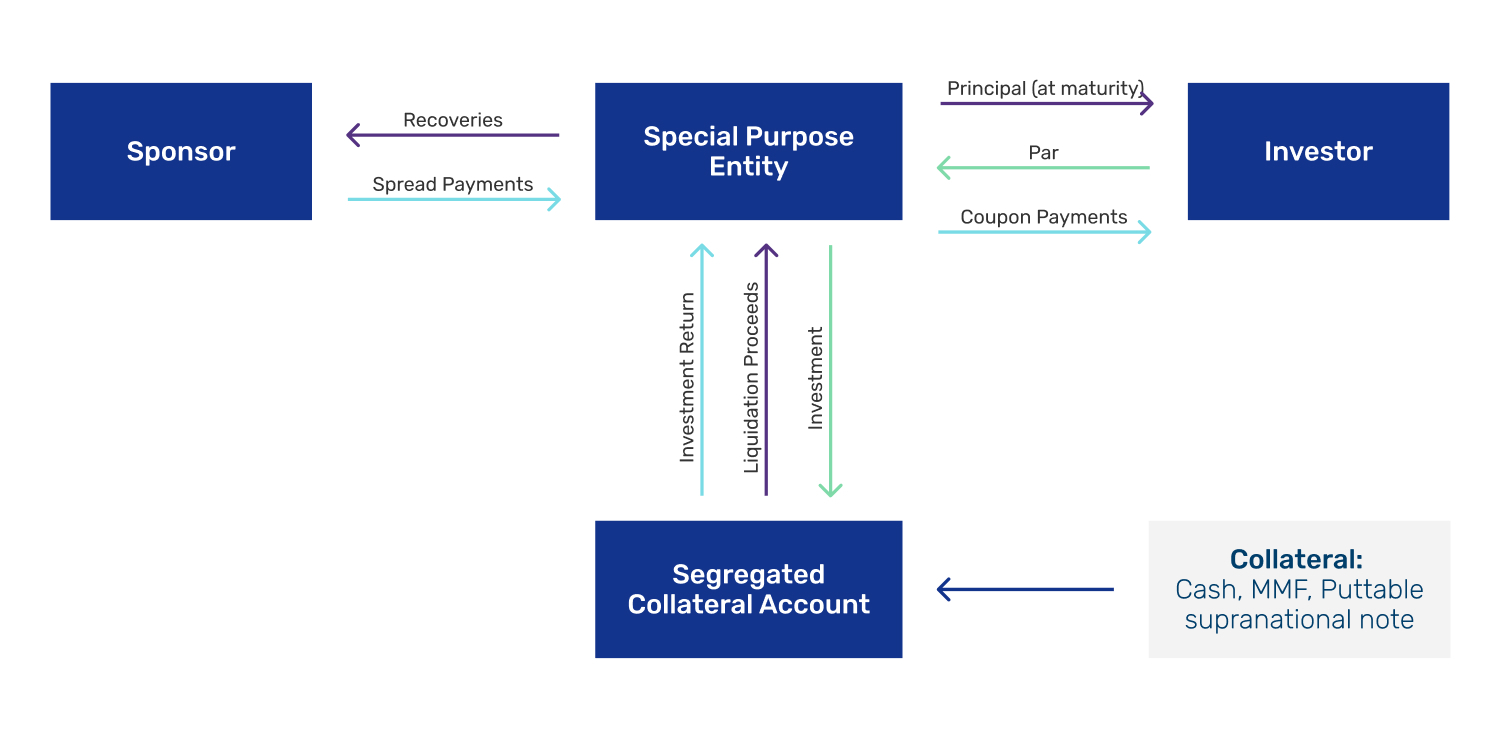
Source: Man Group
Over the past 15–20 years, proceeds have mostly been invested in Treasury money market funds. The associated credit risk may be small, but it is not zero. In 2014, Munich Re’s Queen Street III catastrophe bond recorded a (very slight) shortfall in the amount of principal repaid to investors, having been impacted by market uncertainty surrounding the US debt ceiling crisis.13
While deal sponsors may not have any credit exposure to bond investors, the reverse is not quite true. If a sponsor fails to pay a coupon, a bond may terminate early, leaving investors with redeployment risk. Under such circumstances, the last spread coupon might also not be paid. To mitigate this risk, some sponsors may place the next coupon payment in escrow 14 as a form of credit enhancement.
Liquidity
The cat bond market is broadly ‘buy and hold’ in nature, and volumes tend to be higher in the primary market than in the secondary market. Many cat bonds are eligible for reporting and tracking on FINRA’s Trade Reporting and Compliance Engine (TRACE), making their transaction prices available for analysis. Data reveal that secondary volumes are fairly stable throughout the year. By contrast, primary issuance is seasonal and is generally lighter during the Atlantic hurricane season (Figure 5). For fund managers expecting large inflows, that seasonality may affect how quickly they can deploy capital through new issues.
Figure 5. Primary issuance for cat bonds is seasonal
Source: Man Group database. Shows settlements from July 2024 to June 2026.
Problems loading this infographic? - Please click here
TRACE transaction data provide a valuable guide to pricing and liquidity, supplemented by broker price indications issued weekly, fortnightly or monthly. It is the combination of secondary-market liquidity and pricing confidence that has helped support the development of UCITS cat bond funds, which must offer investors fortnightly liquidity at a minimum. UCITS cat bond funds now represent approximately 32% of the total cat bond market capitalisation.15
The bottom line: Cat bond investors need to consider the risks alongside potential benefits. Risks include limited relevant historical data, evolving models, and risk pricing. Seasonal issuance also warrants review.
Conclusion: diversification when it counts
We believe insurance is one of the few sources of structurally diversifying returns. Cat bonds typically provide this exposure while largely avoiding interest rate and credit risk. That diversification particularly holds when it matters most – during tail-risk events. A financial crash does not cause a natural catastrophe.
For investors, the cat bond market has historically delivered equity-like returns with bond-like volatility over more than two decades. Because returns are primarily driven by physical events rather than market sentiment, and because premiums tend to harden after large losses, drawdowns have been both shallower and shorter than those of equities or bonds. For sponsors, the market offers pricing competition, multi-year cover, and an additional source of capacity.
As the range of perils, sponsors and geographies expands, we believe the market appears well placed for further growth – provided pricing remains attractive to both investors and sponsors.
1. Source: Man Group database, Swiss Re and Bloomberg. Date range: January 2002 to October 2026. Indices: Swiss Re Global Cat Bond Total Return Index hedged to USD.
2. Source: Man Group database, Swiss Re, MSCI, and Bloomberg. Date range: January 2002 to October 2026. Indices: Cat bond index - Swiss Re Global Cat Bond Total Return Index hedged to USD; World stocks - MSCI World Net Total Return Index hedged to USD; World bonds - Bloomberg Global-Aggregate Total Return Index Value Hedged USD; High Yield - ICE BofA Global High Yield Index.
3. Source: Bloomberg based on Swiss Re Global Cat Bond Total Return Index hedged to USD.
4. Source: https://www.intelligentinsurer.com/monte-carlo-today/reinsurance-capital-set-to-hit-record-dollar705bn-am-best, https://riskandinsurance.com/reinsurance-buyers-gain-pricing-power-as-global-capital-hits-record-790-billion
5. Source: Man Group database, MSCI, and Bloomberg. Date range: January 1990 to October 2026. Indices: World stocks - MSCI World Net Total Return Index hedged to USD; World bonds - Barclays Capital Global Aggregate Bond Index Hedged to USD; High Yield - ICE BofA Global High Yield Index.
6. Source: Man Group database. Date range: January 2002 – October 2026.
7. Revisiting the High Yield Bond Market | Nasdaq
8. https://iftrip.org/wp-content/uploads/2020/01/Terrorism-Pool-Index-Nov-1.pdf
9. People’s Insurance Company of China.
10. https://www.artemis.bm/news/china-financial-regulator-continues-to-promote-hong-kong-for-catastrophe-bonds
11. https://www.usgs.gov/faqs/can-you-predict-earthquakes
12. https://en.wikipedia.org/wiki/List_of_California_wildfires
13. Queen Street III cat bond principal repayment falls short, defaults - Artemis.bm
14. Escrow is an arrangement in which an independent third party holds funds or assets on behalf of transacting parties until specified contractual conditions are met, at which point they are released to the appropriate recipient.
15. UCITS catastrophe bond funds keep growing, near $21.8bn combined AUM after September - Artemis.bm
You are now leaving Man Group’s website
You are leaving Man Group’s website and entering a third-party website that is not controlled, maintained, or monitored by Man Group. Man Group is not responsible for the content or availability of the third-party website. By leaving Man Group’s website, you will be subject to the third-party website’s terms, policies and/or notices, including those related to privacy and security, as applicable.