Key takeaways:
- Rising global market dispersion creates greater potential for diversification and Chinese markets' historically low global correlations offer a unique opportunity
- The significant expansion of the Qualified Foreign Institutional Investors (QFII) and internationalised trading routes means offshore investors can better access onshore capital markets
- We believe a China-focused trend-following strategy is well suited to effectively monetise dispersion while delivering strong risk-adjusted returns and portfolio diversification
2025 has been no stranger to major market events. Undoubtedly, a major catalyst has been the return of President Trump, whose appetite for sweeping, significant policy shifts has led to an uptick in both policy and market uncertainty. Despite this challenging environment, the silver lining for investors is that it has also brought about an increase in both inter and intra asset class dispersion. As we discuss here, in theory, greater dispersion should be positive for portfolios because of the increased opportunity set to generate profits.
There is a key distinction between theory and practice, however. An increase in the number of independent directions available in the market (increased theoretical diversification) may not directly translate into better realised diversification in portfolios, driven by prevailing allocations. In an increasingly multipolar world, with greater dispersion on offer, now may be an opportune time to look to new frontiers and broaden portfolio allocations to put theoretical diversification into practice.
An increased allocation to global equity, bond or commodity indices is a seemingly operationally simple first step to do this, but as we discuss here, the realised diversification in global indices is still underwhelming due to underlying regional concentration effects. Instead, a more robust option would be to directly allocate to diversifying, underweight markets, such as emerging markets (EM).
The appeal of EMs lies in their return streams being largely influenced by local, idiosyncratic factors, as opposed to the global macroeconomic forces that drive the largest, macro sensitive assets already traded in portfolios. This feature is even more meaningful in an environment of greater dispersion, as the idiosyncratic component drives a larger proportion of returns.
Among the largest constituents of prominent EM indices are Brazil, China, and India, which also boast highly liquid capital markets, particularly on the derivatives side, with sufficient depth to support investors looking to make more significant allocations.
A constraint for many investors, though, has been the operational headwinds relating to directly accessing these diversifying markets. Nascent offshore access frameworks and associated considerations around regulation, capital reshoring and taxation present complex hurdles for investors. China, however, stands out in this regard, with robust frameworks in place to facilitate global capital.
In this note, we explore developments on market access in China and the unique properties of its capital markets, as well as the possible investment opportunities this fosters for investors seeking to capitalise on dispersion, such as trend-following.
QFII and internationalised access routes
In a bid to broaden participation, price discovery and liquidity, China has developed regulated, sophisticated routes to efficiently access the country’s derivatives markets. These complement existing offshore cash market access routes such as Stock Connect, Bond Connect and China Interbank Bond Market (CIBM). We focus on two key derivatives routes:
- Internationalised contracts, which includes a select number of futures and options that can be directly exchange traded by all international investors. Crude oil was the first of these contracts to be launched in March 2018.
- Qualified Foreign Institutional Investors (QFII/RQFII ), which provides licenced foreign investors with the ability to directly trade a broader set of financial and commodity derivatives contracts.
Our first paper on this subject was published shortly after the China Securities Regulatory Commission (CSRC) approved the expansion of QFII to derivatives in November 2020. However, both the internationalised and QFII schemes have evolved significantly since, with a number of new Chinese futures being made available. August 2022 marked a major breakthrough, with the passage of the Futures and Derivatives Law (FDL), which preceded the introduction of the first batch of QFII markets in September. This batch took the total number of internationalised and QFII contracts to 27 futures and 18 options, from four previously. Fast forward to today, there are now 91 futures and options contracts available for investors to trade via QFII, comprising 46 commodity futures and 38 options. Illustrative of China’s commitment to increasing access, 45 of this total have been added to the scheme in 2025 alone (Figure 1), bringing along with it the cost saving benefits of trading these markets directly on the exchange.
Figure 1. Number of QFII/internationalised markets available by year
Problems loading this infographic? - Please click here
Source: CSRC, Orient Futures Singapore. Date range: January 2018 - June 2025.
Chinese markets: diversifying and liquid
Man AHL was one of the first foreign systematic managers to receive approval for a QFII license in China in September 2020, having been trading Chinese markets systematically onshore since 2014. This experience has enabled us to witness firsthand the diversification benefits from trading these markets. To illustrate this, in Figures 2 and 3, we update a piece of analysis from Hot Commodity: Systematic Investing in China, displaying the correlation of Chinese markets to their global counterparts.
Figure 2. Correlations of Chinese equities and bonds versus select global counterparts
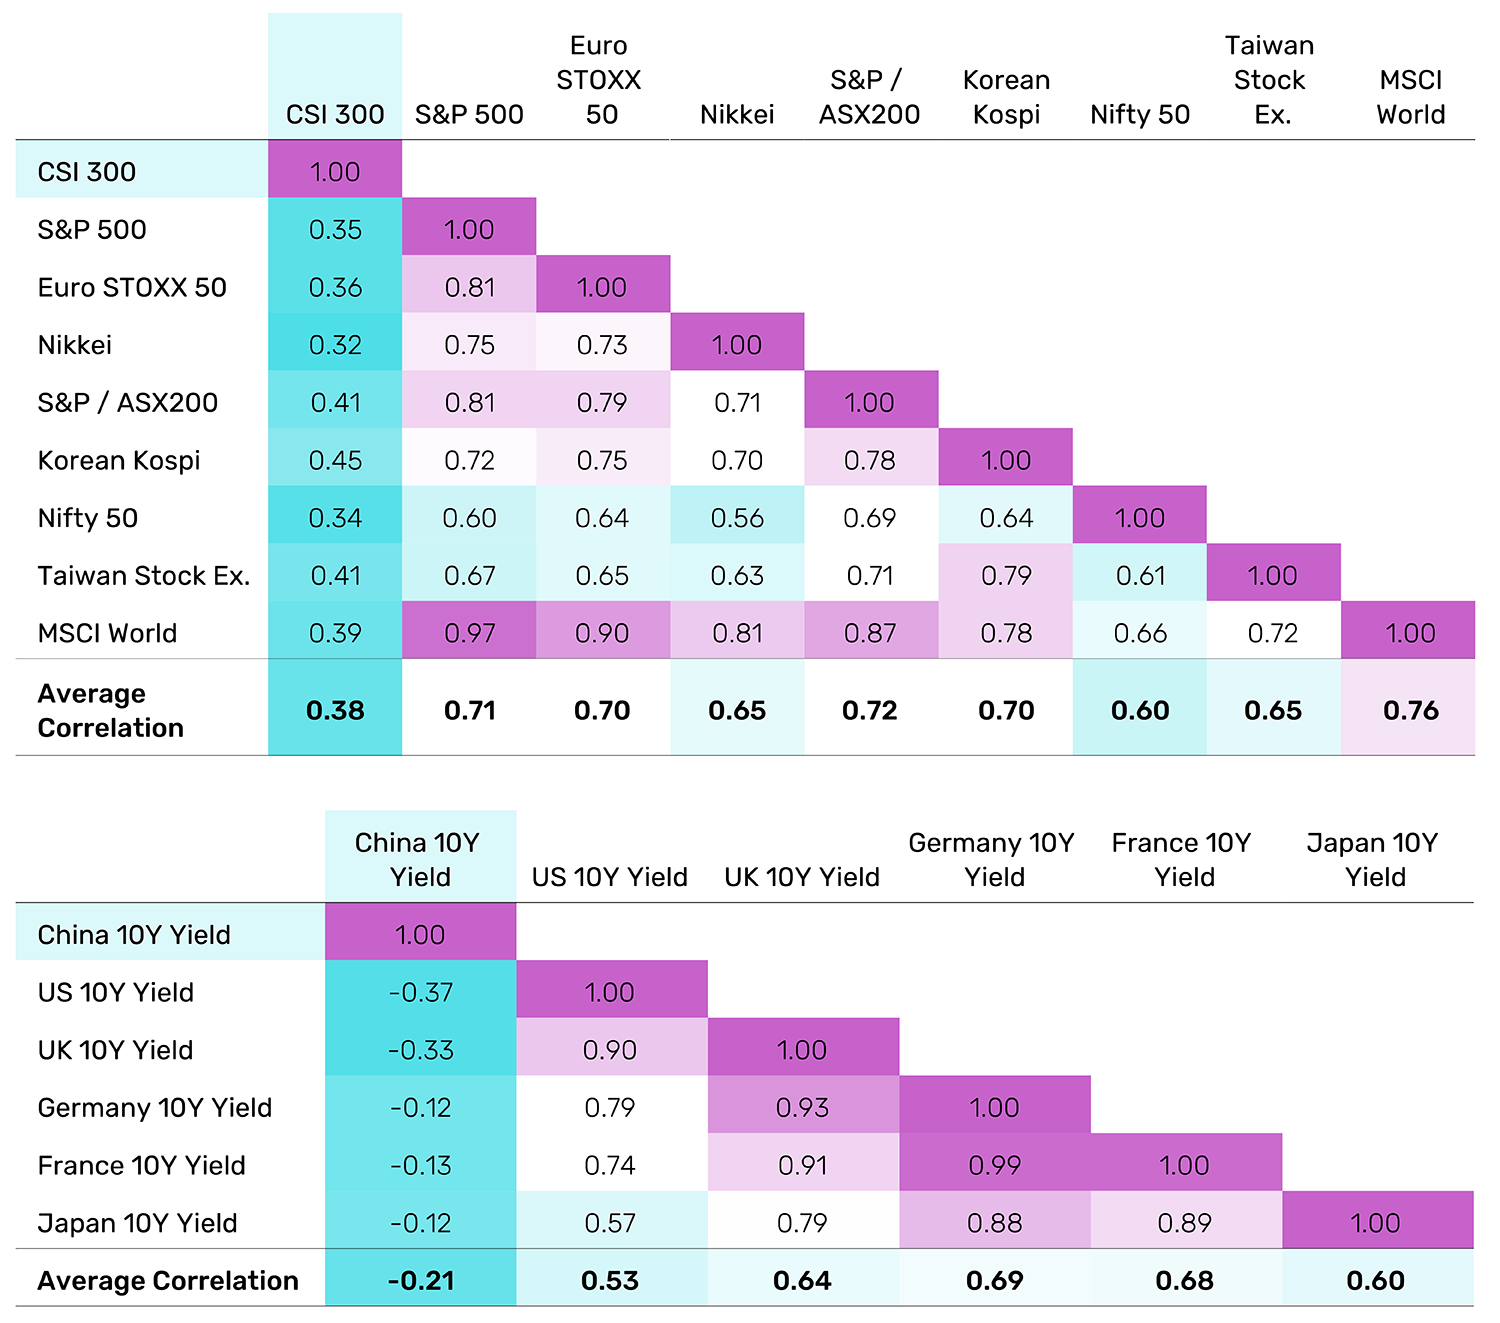
Source: Bloomberg. Date range, LHS: January 2006 to August 2025. RHS: January 2011 to August 2025. Chinese assets highlighted in blue.
Figure 3. Correlations of Chinese commodities versus select global counterparts
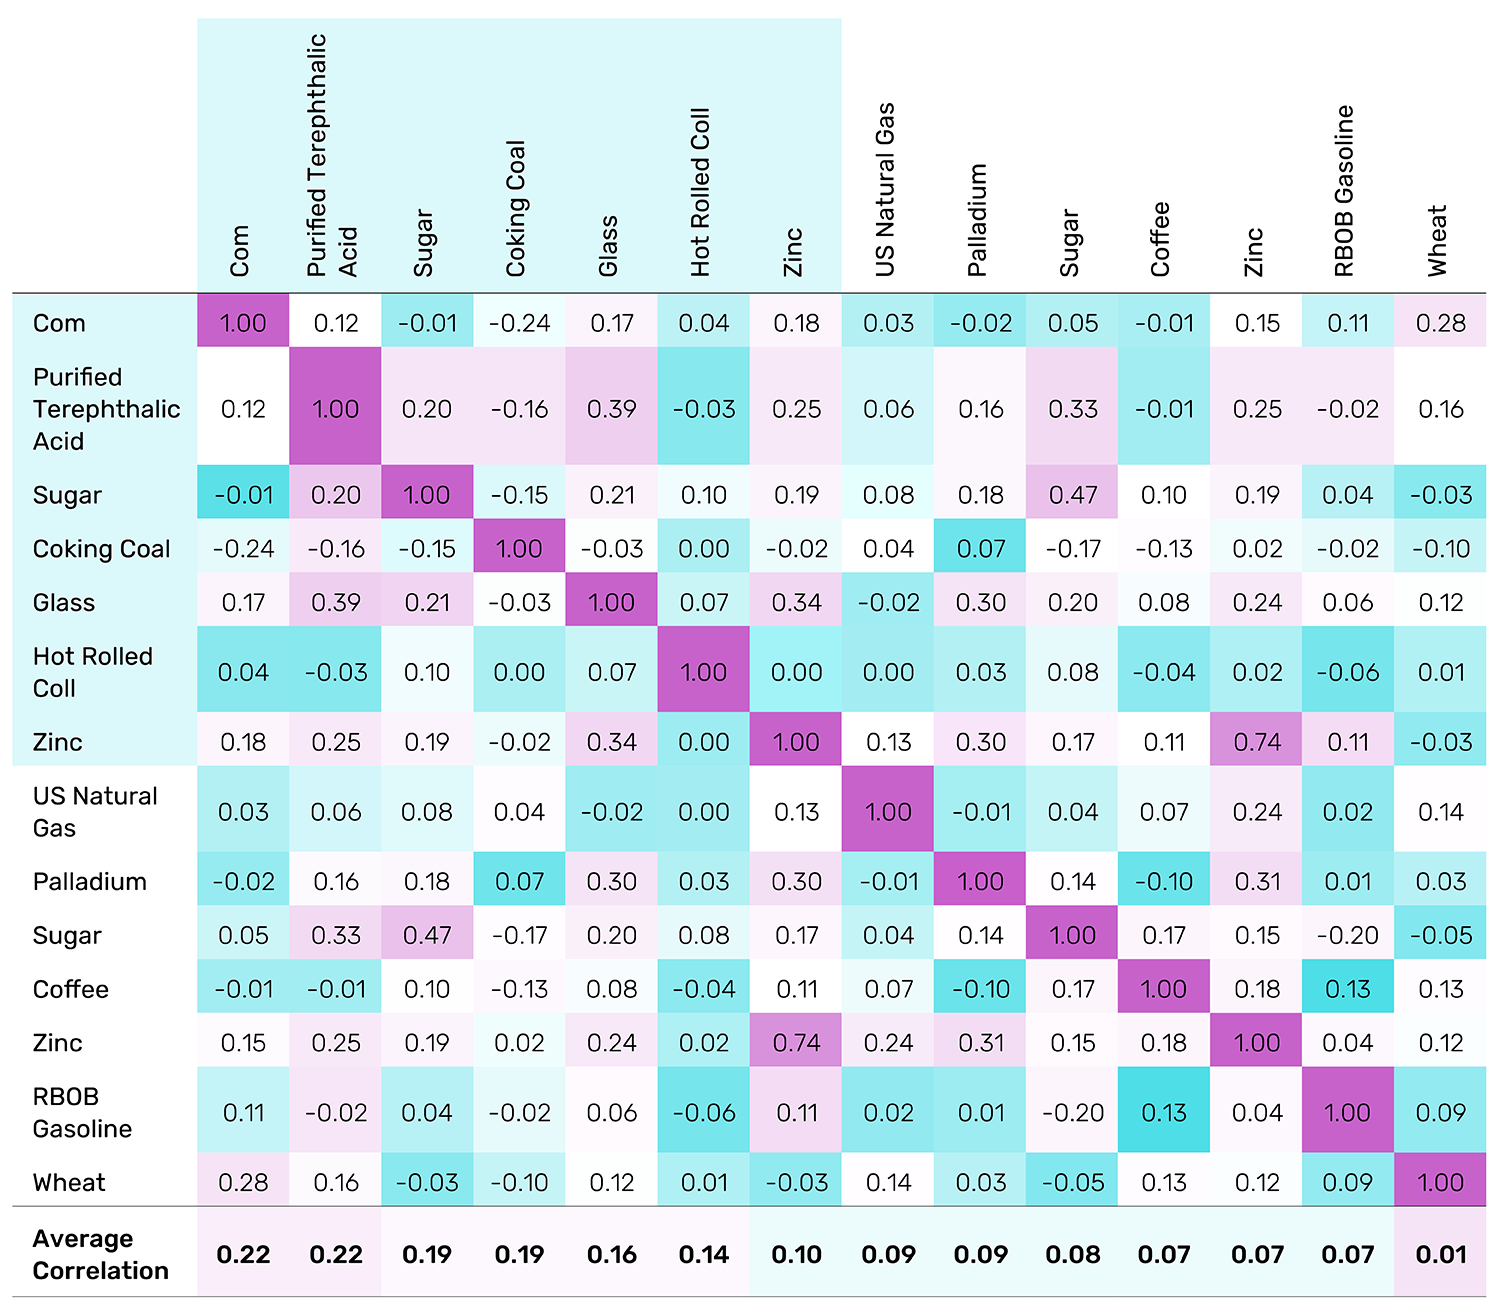
Source: Man Group database and Bloomberg. Date range, January 2015 to August 2025, using monthly data. Chinese asset labels are highlighted in light blue.
Focusing on equities and bonds, Figure 2 shows that the average correlation of Chinese equities with global indices is 0.38, with a corresponding average for bonds of -0.21. Notably, the average correlations of non-China equity indices and 10-year bond yields to each other are all above 0.5. The evidence is even more stark in commodities in Figure 3. As we discussed in our original article, Chinese markets are unique, on the basis that some contracts do not have a corresponding global equivalent, such as purified terephthalic acid. Even where there are ‘equivalents’, some markets are still significant from an alpha perspective as the Chinese contracts display low correlation to the global version. Chinese sugar and ICE-listed US sugar are only 0.47 correlated, representative of the fact that local transport, trade, harvest, weather, and socioeconomic factors ultimately lead to differentiated price action.
Figure 4. China liquidity metrics by asset class
Problems loading this infographic? - Please click here
Problems loading this infographic? - Please click here
Problems loading this infographic? - Please click here
Source: FIA, BIS, Bloomberg. Date range: top panel, as of 31 August 2025; middle panel, calendar year 2024, volume shown as aggregated by all exchanges domiciled in a given country; bottom panel, as of 31 December 2024.
Allocating to Chinese markets
The critical question, therefore, is how to translate these compelling market characteristics into an investment strategy. The expansion of the QFII framework to derivatives, along with the liquidity of the underlying markets, naturally lends itself towards a trend-following strategy as it provides the core building blocks of leverage and directionality. Trend-following strategies also inherently provide the ability to trade multiple markets in a long/short fashion, thereby increasing the opportunity to monetise the dispersion by capturing price moves in any market and any direction that they occur.
China trend-following: What’s not to like?
In Trend-Following: What’s not to Like? we identified three key features of trend-following strategies; diversification, absolute returns and crisis alpha. We delve into the existence of these features for Chinese markets below.
Absolute return
Figure 5 shows a China trend-following (China Trend) strategy targeting 15% volatility, which trades roughly 80 markets across equities (index futures and cash equities), bonds, metals, industrials, agriculturals and energies. The strategy applies a combination of moving average crossover and breakout signals with an average holding period of around 11 weeks. Representative trading costs are also applied based on the available market access route.
We compare this strategy to Chinese equities, proxied by the CSI300, and global trend-following, proxied by the SG Trend Index. China Trend outperforms both Chinese equities and global trend in absolute return, risk-adjusted return and Sharpe ratio terms over the period, all while displaying a low correlation to both indices.
Figure 5. China Trend versus Chinese equities and SG Trend Index
Problems loading this infographic? - Please click here
Problems loading this infographic? - Please click here
Source: Man Group database, Bloomberg, Societe Generale. Date range, March 2014 to August 2025. Representative China Trend-Following is shown net of 2% management fee and 20% performance fee.
Diversifying the diversifier
Investors typically allocate to global trend-following strategies within the ‘diversifiers’ sleeve of their portfolio because of their low correlation to traditional investments. So, why is there a need for an additional trend-following strategy, specifically one that trades Chinese markets if it has the same key properties? The answer lies in the correlation of China Trend with Global Trend, at 0.25.
Aside from the correlation in the body of the distribution, the diversification of China Trend extends to the tail. Tail events for trend-following often come from sudden market reversals. While both global and Chinese implementations are susceptible to reversals, the low correlation of the underlying markets means that the trend -following implementations are also lowly correlated. In Figure 6, we look at the performance of China Trend versus the SG Trend Index when it experiences a reversal of over 5% over the last three years.
Figure 6. Representative China trend-following strategy versus SG Trend Index during reversals
Problems loading this infographic? - Please click here
Problems loading this infographic? - Please click here
Problems loading this infographic? - Please click here
Source: Man Group database, Bloomberg, Societe Generale. Date range, March 2023 – May 2023; July 2024 – September 2024; March 2025 – May 2025. Representative China Trend-Following is shown net of 2% management fee and 20% performance fee.
Looking solely at the China Trend line during each of the three reversals, it would be challenging to tell that a major market event has even occurred, with performance either flat or positive through each event. We might offer two reasons as to why this is the case. First, Chinese derivatives markets are dominated by commodities, and therefore naturally comprise a greater allocation of the trend portfolio. Second, commodities tend to be less correlated than equities and bonds to the macro environment, particularly Chinese commodities, as we showed Figure 3.
Implementing an allocation
Having established its diversification credentials, as we discuss in If it Moves, Monetise It, the capital efficient nature of trend-following strategies means that an allocation to China Trend can be easily implemented alongside a traditional trend-following strategy, without having to raise any spare cash. For example, assuming that an allocation to a traditional trend-following strategy requires 25% of cash to fund 100% of notional, inclusive of a buffer, the excess, 75% cash can be used to fund the China Trend allocation. In Figure 7, we illustrate a portfolio with a 100% allocation to the SG Trend Index, alongside a version that applies additional leverage to gain an additional 25% allocation to China Trend. The combined portfolio realises an improvement in both return and Sharpe, while maintaining a similar drawdown and risk profile to the 100% SG Trend Index portfolio, despite the higher leverage.
Figure 7. Performance comparison of 100% SG Trend Index versus 100% SG Trend Index + 25% China Trend
Problems loading this infographic? - Please click here
Problems loading this infographic? - Please click here
Source: Man Group database, Bloomberg, Societe Generale. Date range, March 2014 to August 2025. China Trend is net of 2% management fee and 20% performance fee.
Lots to look forward to
China has a robust pipeline of new market launches in the wings, particularly relating to the Guangzhou Futures Exchange (GFEX). The GFEX launched in April 2021 as the sixth and newest of the flagship China commodities exchanges, with a focus on products deemed crucial to China’s green transition and sustainable development. For example, the exchange’s first two launches, industrial silicon and lithium carbonate, were first-of-their-kind contracts, both of which had a crucial focus on renewable energy. Specifically, the former is used in solar panels and semiconductors, while the latter is a critical component in EV batteries. This unique mandate will likely breed a range of diversifying new markets going forward, with GFEX officials signalling the potential futures launches of carbon emissions, rare earth materials (highly relevant today given Sino-US trade talks), platinum and palladium. CSRC Chairman, Wu Qing, also pledged to raise the number of eligible QFII markets to 100 in the “near “future3”, which will positively compound this diversification benefit by a cost-saving one too.
Bibliography
Bordigoni, G, Chang, A, Mackic, A, Rossini, S, Straker, K. (2021), “A Hot Commodity: Systematic Investing in China”, Man Institute, Available at: https://www.man.com/maninstitute/hot-commodity
Korgaonkar, R. (2025), “The Big Picture: Divergent Policies, Divergent Markets”, Man Institute, Available at: https://www.man.com/insights/the-big-picture-divergent
Robertson, G. (2023), “What's Trending: Trend-following - What's Not to Like?”, Man Institute, Available at: https://www.man.com/maninstitute/trend-following-what-not-to-like
Robertson, G. (2023), “Trend-Following: If it Moves, Monetise it!”, Man Institute, Available at: https://www.man.com/maninstitute/trend-following-if-it-moves-monetise
1. QFII is a certification programme launched in 2002 by the Chinese government, allowing foreign or offshore institutional investors to invest in exchange-traded China A-shares, bonds and fixed income products traded in the China inter-bank bond market, among other instruments as permitted under QFII rules, directly within China’s domestic markets.
2. https://www.simmons-simmons.com
3. https://www.globaltimes.cn
You are now leaving Man Group’s website
You are leaving Man Group’s website and entering a third-party website that is not controlled, maintained, or monitored by Man Group. Man Group is not responsible for the content or availability of the third-party website. By leaving Man Group’s website, you will be subject to the third-party website’s terms, policies and/or notices, including those related to privacy and security, as applicable.