Key takeaways:
- The optimal market mix remains a fundamental question for trend followers. We aim to answer this question by evaluating different combinations based on their expected Sharpe and expected crisis Sharpe
- Our findings reveal a trade-off: investors prioritising defensiveness (crisis Sharpe) should favour traditional markets, while those focused on maximising long-term Sharpe should overweight alternative markets. No single mix is universally optimal, and investors should tailor allocations to their specific objectives. In the context of this paper, we focus on the maximum Sharpe and maximum crisis Sharpe portfolios as examples
- For some investors, cash efficiency is key. We also demonstrate how investors can construct a highly cash-efficient portfolio that takes advantage of the low margin requirements of liquid futures and forwards
Introduction
Diversification is the primary tool for increasing portfolios’ Sharpe ratio (a metric for risk-adjusted return which shows excess return per unit of risk). Almost all clients we work with have portfolios that incorporate equities, credit, bonds, private markets and alternative assets including commodities, real estate and hedge funds. Since these assets aren’t perfectly correlated, incorporating them in a mix will boost the expected Sharpe ratio of the portfolio. So far, so good.
But here’s the problem: many of these assets have similar underlying return drivers. Consider stocks, credit, real estate and private equity, all of which rely on a growing economy for price appreciation. When this driver breaks down in a recession or other market event, these assets can sell off together. Diversification fails when investors need it most.
This is where trend following comes in. Unlike traditional assets, trend following does not rely on economic growth to generate returns and has historically been uncorrelated to equities, bonds, real estate and other asset classes. More importantly, it has tended to perform best precisely when other asset classes struggle, offering a valuable counterbalance when stocks are meaningfully down* (interested readers can find introductory papers on this topic here and here). Figure 1 summarises this defensive property, with trend historically delivering in the worst periods for equities, while the performance of bonds and multi-strategy hedge funds are mixed.
Figure 1. Trend following has had greater positive performance in the first equity quintile, showing positive returns in many of the worst equity quarters and indicating positive convexity
Problems loading this infographic? - Please click here
Shows quarterly performance of trend following (left), bonds (middle) and multi-strategy hedge funds (right) on y axis plotted against quarterly equity returns on x axis. Source: Man Group database, Bloomberg. Date range: Jan 2000 – Oct 2025 for trend following and bonds, Jan 2014 – Oct 2025 for multi-strategy. Trend following illustrated by SG Trend index, bonds by Barclays Global Aggregate Index and multi-strategy by HFRI Multi-Manager Pod Shop Index. Past performance is not indicative of future returns. Any organisations, financial instruments or products mentioned are for reference purposes only and therefore, this material should not be construed as a recommendation for their purchase or sale.
Crucially, not all trend portfolios are alike. The universe of tradeable markets is vast, spanning different liquidity profiles, economic return drivers and diversification properties. Different blends will produce different outcomes - not just in expected Sharpe ratio, but in defensiveness during crises. For investors, this difference is critical, since a more defensive trend portfolio may be a better complement to an equity allocation, whereas an investor looking at trend following alongside other hedge funds may prefer a trend portfolio closer to maximum Sharpe.
In what follows, we explore the trend-following market mixes that optimise for maximum expected Sharpe and maximum expected crisis Sharpe*.
* Throughout this paper we use crisis Sharpe/defensiveness/convexity interchangeably, all to mean better expected performance in difficult environments for traditional assets, such as equities and bonds. This is a characteristic trend-following investors prize for its portfolio impact, potentially offering an offset in crisis periods.
The starting point: traditional trend-following markets
Traditional trend-following markets are the large, exchange‑traded futures and forwards that anchor the commodity trading advisor (CTA) universe: equity indices (for example, S&P 500), government bonds (US Treasuries), major foreign exchange (USD/GBP) and core commodities (gold, copper, crude oil). They are highly liquid, transparent and operationally simple, with deep capacity, tight bid/ask spreads and long data histories, making them efficient to access at scale, and total around 50-150 markets depending on who you ask. Trend following across these markets offers the combined attractiveness of a positive expected long-run Sharpe and positive expected crisis Sharpe.
Traditional markets can proxy the key macro risk factors present in the global economy. For example, growth, inflation, monetary policy and world trade movements can all be captured using a combination of these liquid markets. Figure 2 shows market combinations that may be sensitive to moves in each of these macro factors. These are illustrative examples – and trend following will capture many more effects – but in big macro events like an equity collapse, these core markets typically feel the largest impact.
Figure 2. Example trend-following markets that may be exposed to different global economic factors. Trend may be long or short these markets dependent on the economic regime
Problems loading this infographic? - Please click here
Source: Man Group database. Market sets for illustration only.
Since trend-following models can be both long and short, traditional markets tend to exhibit the strongest defensiveness (higher expected crisis Sharpe) during broad, cross‑asset sell‑offs, providing potential ‘crisis alpha’ to multi‑asset portfolios. In stressed environments, movements in the largest macro risk factors are amplified, generating more opportunities for trend to position appropriately (long or short) and to benefit. Note that running a responsive system is also key in capturing these defensive properties, a topic we discuss at length in ‘The Need for Speed’.
However, the influence of these macro factors is not constant. They can go through periods of being more or less significant in the context of the global economy. This can be analysed by decomposing trend-following returns into the four macro factors, plus a residual, or idiosyncratic, component. Figure 3 shows this decomposition using a naïve 1/n market allocation scaled to 10% return volatility.
Figure 3. Factor and idiosyncratic return decomposition in traditional market trend following
Problems loading this infographic? - Please click here
Source: Man Group database. Date range: Jan 2005 – Oct 2025. Past performance is not indicative of future returns. Any organisations, financial instruments or products mentioned are for reference purposes only and therefore, this material should not be construed as a recommendation for their purchase or sale.
The level of factor dominance has implications for trend-following portfolios. In environments where factors can explain a large portion of returns - typically during macro regime shifts like an extended bull run, inflation surge or market sell off - being long or short traditional markets can deliver outsized gains, with many markets moving in tandem and generating strong, persistent trends. Conversely, when macro factors explain less of the variance in returns, markets behave more idiosyncratically. These macro factors will struggle to find a persistent direction, and the system must look for opportunities driven by market-specific rather than macro factors. One enhancement to traditional trend-following portfolios may therefore be expanding the market set into alternative markets, where potentially more idiosyncratic opportunities lie.
Figure 4. Factor and idiosyncratic return decomposition in alternative market trend following
Problems loading this infographic? - Please click here
Source: Man Group database. Date range: Jan 2005 – Oct 2025. Past performance is not indicative of future returns. Any organisations, financial instruments or products mentioned are for reference purposes only and therefore, this material should not be construed as a recommendation for their purchase or sale.
While moving towards alternative markets and away from traditional ones will begin to dilute the defensiveness against broad macro selloffs, it offers a more diversified opportunity set. Additional idiosyncratic bets improve the long-run Sharpe ratio, reflected in the higher proportion of returns attributable to the idiosyncratic component and the lower attribution from macro factors (Figure 4). This is the inverse of what we observe for trend-following traditional markets (Figure 3), creating a central trade-off for investors: maximum crisis Sharpe versus maximum Sharpe. Let us now turn to look at how different market mixes impact this choice.
Expanding into alternative markets
Given the unpredictable nature of price trends, investors could consider broadening their scope to encompass both traditional and alternative markets. Alternative markets offer exposure to idiosyncratic, market-specific risk factors that drive diversifying price trends. To take just one example, Scandinavian hydroelectric power is driven primarily by localised demand and supply factors independent of the largest macro risk factors we describe above.
Alternative markets come in many guises (Figure 5), ranging from harder-to-access, liquid markets such as index credit default swaps (CDS) or onshore Chinese markets, to less liquid, esoteric markets, such as the Ghanaian cedi or the dairy complex (milk, cheese and butter). Historically, applying trend-following models to this diversified set of markets has delivered higher absolute returns.
Figure 5. Balancing liquidity and complexity across trend-following markets
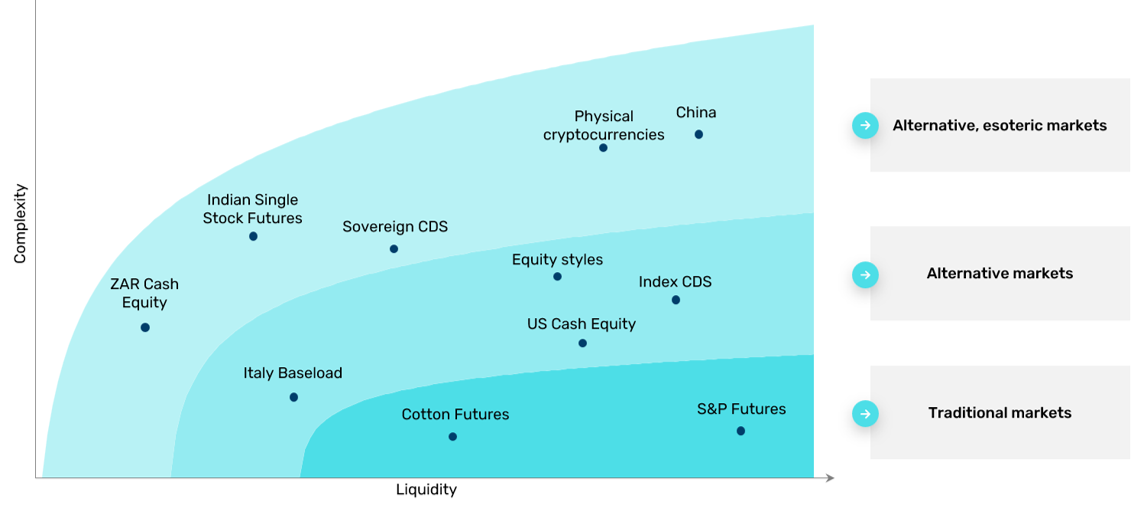
Source: Man Group database. Market sets for illustration only. Date range: Jan 2015 - Dec 2024.
Importantly, classifying a market as alternative doesn’t equate to it being inherently less liquid. China, for example, offers access to some of the world’s most liquid markets. These markets exhibit low correlation to their global counterparts and include unique contracts without global equivalents, such as purified terephthalic acid.
Synthetic markets – which allow trend followers to trade themes in markets versus the markets themselves – can also provide further diversification from traditional markets. Equity styles, constructed by cross-sectionally ranking cash equities based on fundamental metrics representative of a particular investment style, are a well-documented example. Trend following applied to equity styles not only offers a more robust way to monetise equity styles but is also highly diversifying to traditional index-based trend following. This is highlighted in Figure 6 which plots the five-year rolling correlation between the two.
Figure 6. Correlation between trend-following equity indices and equity styles
Problems loading this infographic? - Please click here
Source: Man Group database. Date range: Dec 2011 - Oct 2025.
Some argue (Babbedge & Kerson, 2019) that alternative markets’ higher realised returns can be attributed to their higher individual information ratios (IR) or, in layman’s terms, that they’re more ‘trendy’. This view rests on the observation that these markets exhibit certain characteristics, such as being relatively insulated from macroeconomic policy, which can cap or floor trends, or that they are dominated by hedgers rather than speculators, which leads to less competition and a natural transfer of alpha. These characteristics are believed to contribute to alternative markets exhibiting a greater degree of ‘trendiness’, or autocorrelation, compared with traditional liquid futures and forwards markets.
While there is some evidence to support this, the case for greater internal diversification is clearer. For simplicity, we assume equal IR per market for the purposes of this analysis, removing any need to assume additional ‘trendiness’ from alternative markets.
In Figure 7, we compare principal components across traditional, alternative and alternative esoteric trend-following programmes. Principal components measure how many independent return drivers there are in a portfolio — essentially, how many uncorrelated bets you're making. More principal components indicate greater diversification: returns coming from many distinct sources rather than a few correlated markets, which typically leads to higher expected Sharpe ratios. The chart plots the number of principal components, explaining 95% of the variance in returns on a rolling one-year basis. The higher the number, the more diversification you have from the markets traded.
Figure 7. Principal component analysis displaying the number of orthogonal PCA’s explaining 95% of variance on a rolling one-year basis
Problems loading this infographic? - Please click here
Source: Man Group database. Market sets for illustration only. Date range: Jan 2015 to Sept 2025.
This also relates to the macro factor discussion we illustrated in Figure 3. The higher number of principal components required to explain the variance of returns in alternative markets translates to a higher proportion of returns attributed to the idiosyncratic component, while the returns from trend following traditional markets are principally attributed to the main macro factors (examples in Figure 2).
The diversification benefit (as measured by the ratio of the sum of the volatilities divided by the volatility of the portfolio) rises as the market set expands, as shown in Figure 8. Over time, this is a key parameter in enhancing risk-adjusted returns, although it must be balanced against trading costs and slippage. This raises the question: what is the optimal market mix?
Figure 8. Diversification benefit from expanding the market set beyond traditional markets
Problems loading this infographic? - Please click here
Source: Man Group database. Market sets for illustration only. Date range: Jan 2015 to Dec 2024. Diversification does not ensure a profit or protect against a loss.
What is the optimal mix of markets?
To answer this, we consider six non-overlapping sets of markets:
Figure 9. Which markets are considered?
Problems loading this infographic? - Please click here
Source: Man Group database. Market sets for illustration only.
For each market set, we run a mix of moving average crossovers and breakout momentum signals, with a holding period of approximately three months, broadly representative of the medium-frequency trend-following universe. Allocation is performed via maximum diversification, which incorporates volatility, correlation and liquidity by market, with no prior assumptions about returns. The performance of each market set is shown in Figure 10. The start date for each is based on the pricing availability of the underlying markets; while some markets may be less liquid, they still have reasonable pricing histories.
Figure 10. Account curves for the six sets of markets standalone
Problems loading this infographic? - Please click here
Problems loading this infographic? - Please click here
Source: Man Group. Date range: 1995 - 2025. Simulated past performance is not indicative of future results. Returns may increase or decrease as a result of currency fluctuations.
As shown, each of these market sets exhibits positive long-run Sharpe, with low correlation to both equities and bonds. Additionally, all market sets exhibit negative correlation when equity markets are down, and as expected, the most negative correlation comes from trend following on traditional markets. (Figures 11 and 12).
Figure 11. Correlation matrix for the six sets of markets
Problems loading this infographic? - Please click here
Source: Man Group. Date range: 1 May 2015 - 30 September 2025. Simulated past performance is not indicative of future results. Returns may increase or decrease as a result of currency fluctuations.
Figure 12. Correlation matrix for the six sets of markets when the MSCI World is down
Problems loading this infographic? - Please click here
Source: Man Group. Date range: 1 May 2015 - 30 September 2025. Simulated past performance is not indicative of future results. Returns may increase or decrease as a result of currency fluctuations.
Given the positive Sharpe and low correlations across our six market sets, we can now strategically combine them to create portfolios tailored to investors’ objectives.
In what follows, we focus on two common investor priorities:
- Max Sharpe Portfolio: Optimises allocations across all markets to maximise expected long-run Sharpe ratio. This approach suits investors seeking trend following as a diversifying return source within broader hedge fund or multi-asset portfolios.
- Max Crisis Sharpe Portfolio: Optimises allocations across all markets to maximise expected performance during equity market stress periods. This approach suits investors prioritising trend following's defensive properties — either as a crisis hedge or complement to other defensive strategies.
Figure 13 summarises our findings, though we would note that other investor priorities can be catered for by different market allocations.
Figure 13. The optimal market mix for maximum expected Sharpe (left) and maximum expected crisis Sharpe (right)
Problems loading this infographic? - Please click here
Problems loading this infographic? - Please click here
Problems loading this infographic? - Please click here
Source: Man Group. Date range: 2007 - 2025.
Both portfolios deliver positive Sharpe ratios, while being negatively correlated to equities. By construction, the Max Sharpe Portfolio has a lower weight to the traditional market set, with higher allocations across the broader alternative market sets, which have historically delivered a higher Sharpe ratio. This is unsurprising for the reasons we detailed earlier. The Max Crisis Sharpe Portfolio, by comparison, upweights the allocation to traditional markets, given the superior convexity profile of these markets during periods of market stress. In practice, investors should be cognisant that achieving the optimal mix is dependent on portfolio size, as capacity in the smaller, more esoteric markets may become a constraint as the portfolio increases in size.
What about cash efficiency, or liquidity?
Given the nature of the assets traded, trend-following strategies can generally be accessed in a highly cash-efficient way, with the underlying building blocks requiring less than US$1 of funding per US$1 of exposure. For investors looking to optimise for capital efficiency, it is possible to alter the market composition to create a portfolio which achieves a higher level of volatility, meaning that investors don’t have to de-allocate as much from other segments of their portfolio to achieve the desired level of trend-following exposure. The low margin usage of liquid futures and forwards makes this possible. In Figure 14, we illustrate a maximum Sharpe optimisation with a minimum portfolio volatility of 25% to provide a sense of what a highly cash-efficient portfolio would look like.
Figure 14. The optimal market mix for cash-efficient, maximum volatility portfolio
Problems loading this infographic? - Please click here
Problems loading this infographic? - Please click here
Problems loading this infographic? - Please click here
Source: Man Group. Date range: 2007-2025.
As shown, the resulting portfolio has a higher allocation to traditional markets versus alternatives. As well as being the most capital efficient, traditional markets are also the most liquid, providing investors who need to call capital at short notice with (potentially) daily liquidity. This is of particular importance during periods of market stress, such as the crisis in the liability-driven investment (LDI) market during September 2022, when defined benefit schemes required liquidity to meet short-term funding needs. This overweight to traditional markets means the resulting Cash-Efficient Portfolio is close to the Max Crisis Sharpe Portfolio, which also utilised traditional markets to provide its additional defensiveness.
Summary
As we have shown, the optimal market mix requires balancing defensiveness, expected Sharpe ratio and cash efficiency. We considered six distinct market sets - ranging from traditional to alternative to crypto - to address different investor priorities and illustrated this with three portfolio examples:
- Maximum Sharpe Portfolio: tends towards alternative markets, with a lower allocation to traditional, to generate as many idiosyncratic bets as possible. Suited for investors viewing trend following primarily as a diversifying and return-seeking allocation within a broader hedge fund or multi-asset portfolio.
- Maximum Crisis Sharpe Portfolio: tends towards traditional markets to optimise performance during equity (or other macro market) drawdowns. More suited to investors prioritising trend following's defensive characteristics, for example as part of a crisis mitigation strategy or complement to other tail-risk strategies.
- Cash-Efficient Portfolio: majors on the low margin requirements of traditional futures to achieve a higher volatility target. This construction somewhat aligns with the Maximum Crisis Sharpe Portfolio and can offer the additional benefits of faster liquidity, as well as a lower expected capital commitment.
Crucially, this is a matter of optimisation, and not compromise, since all three portfolios deliver low correlation to traditional markets and positive expected crisis performance. Investors are therefore selecting their preferred balance of attractive outcomes. The Sharpe trade-off, it turns out, is not such a sharp trade-off.
Bibliography
Mackic, A. (2023), “The Need for Speed in Trend-Following Strategies”, Man Institute, Available at: https://www.man.com/maninstitute/need-for-speed-trend-following
Robertson, G. (2023), “What's Trending: Trend-following - What's Not to Like?”, Man Institute, Available at: https://www.man.com/maninstitute/trend-following-what-not-to-like
Robertson, G. (2023), “Trend-Following: If it Moves, Monetise it!”, Man Institute, Available at: https://www.man.com/maninstitute/trend-following-if-it-moves-monetise
Korgaonkar, R. (2025), “Trend Following and Drawdowns: Is This Time Different?”, Man Institute, Available at: https://www.man.com/insights/is-this-time-different
Panjabi, Y, Bordigoni, G. (2025), “Eastern Frontier: Unlocking Diversification in China”, Man Institute, Available at: https://www.man.com/insights/eastern-frontier
Babbedge, Thomas and Kerson, Scott, Trend’s Not Dead (It’s Just Moved to a Trendier Neighbourhood) (May 1, 2019). Gresham Investment Management, 2019, Available at SSRN: https://ssrn.com/abstract=3404669
Goodall, R, Abou Zeid, T, Mackic, A. (2025), “Truth or Trend: Separating Signal from Noise”, Man Institute, Available at: https://www.man.com/insights/truth-or-trend
You are now leaving Man Group’s website
You are leaving Man Group’s website and entering a third-party website that is not controlled, maintained, or monitored by Man Group. Man Group is not responsible for the content or availability of the third-party website. By leaving Man Group’s website, you will be subject to the third-party website’s terms, policies and/or notices, including those related to privacy and security, as applicable.