Technology > Smart Analytics: Fully automated, interactive plotting with JupyterLab Autoplot

TECH ARTICLE | 5 MIN

Smart Analytics: Fully automated, interactive plotting with JupyterLab Autoplot

January 25, 2021

Real-time, interactive, auto-plotting charts on JupyterLab. Read about our newly open-sourced add on!

Plotting isn’t always easy. Even as an experienced developer or researcher you find yourself googling "python line chart", looking for an example, and then picking between matplotlib, plotly or many other options.

This state of affairs leaves a lot to be desired. In contrast, we wanted to make it so easy that a plot would appear before you even knew you needed it! To do this, we created Autoplot for JupyterLab, a way of easily creating visualisations on the fly and made it open source via GitHub - so it's available for anyone to try out!

What is JupyterLab?

JupyterLab is a web-based user interface for writing and running Python code. It's great for developers, researchers and data scientists to quickly explore ideas, try out code, and dig into data. We use JupyterHub, which provides a multiuser environment on top of JupyterLab. JupyterHub makes it easy to share code between users, and hence increases the ease of collaboration.

JupyterLab is widely used across the Python speaking world. It is distinguished by its usefulness for rapidly testing new concepts or "playing with data". It will probably never replace a fully integrated developer environment ('IDE'), but it significantly lowers the barrier of entry to writing Python code. This has helped us on our path toward data science democratisation, by putting the power of Python into many more peoples' hands. Compared to many other ways of working, having JupyterLab in our workflow vastly reduces the time between having an idea to testing that idea with Python code. We have an internal JupyterHub site that we simply refer to as "https:// python". Visiting that site will let you write and run Python code in seconds. The code can then be shared to other users by sending a link, and seconds later they can be running the same code, seeing the same results, and building upon what you started. In short, JupyterLab has paved our path towards true collaboration and innovation.

One of the main benefits of JupterLab is that it reduces the cognitive load required to just get going. Before using JupyterLab, a typical workflow might involve:

  • logging in to the Linux environment;
  • creating a Python virtual environment;
  • installing the packages you think you might need;
  • launching the IDE of choice;
  • integrating with Git;
  • finally write some Python code;
  • publish your code to Git so that you can collaborate with others.

Each of the above steps require cognitive input. JupyterLab, on the other hand, hides these complexities as far as possible, allowing you to focus on what you are really trying to achieve. This lets beginners focus on learning Python skills without confusing distractions. The JupyterLab workflow of minimal distraction was our inspiration when we created a drastically improved chart reaction workflow.

JupyterLab Autoplot

Jupyter Autoplot is a charting plugin, an extension for JupyterLab. It aims to make charting "come for free". Instead of a user saying, "here is my data, please plot it", Autoplot will automatically:

  • Look at all the data the user has loaded;
  • Analyse it to see if it's plottable;
  • Draw the data in a chart.

Autoplot even responds in real time too, so when the user loads more data, it is Autoplot-ed live!

Once a chart has been created, the user can begin interacting with it, by zooming, panning, turning lines on and off, and finally saving it back to the JupterLab notebook, where it can be shared or copied to an email or Slack message.

Autoplot is quick and easy to setup. Installation instructions are in the README, and as mentioned, it's open source so do try it out!

Figure 1. JupyterLab Autoplot in action
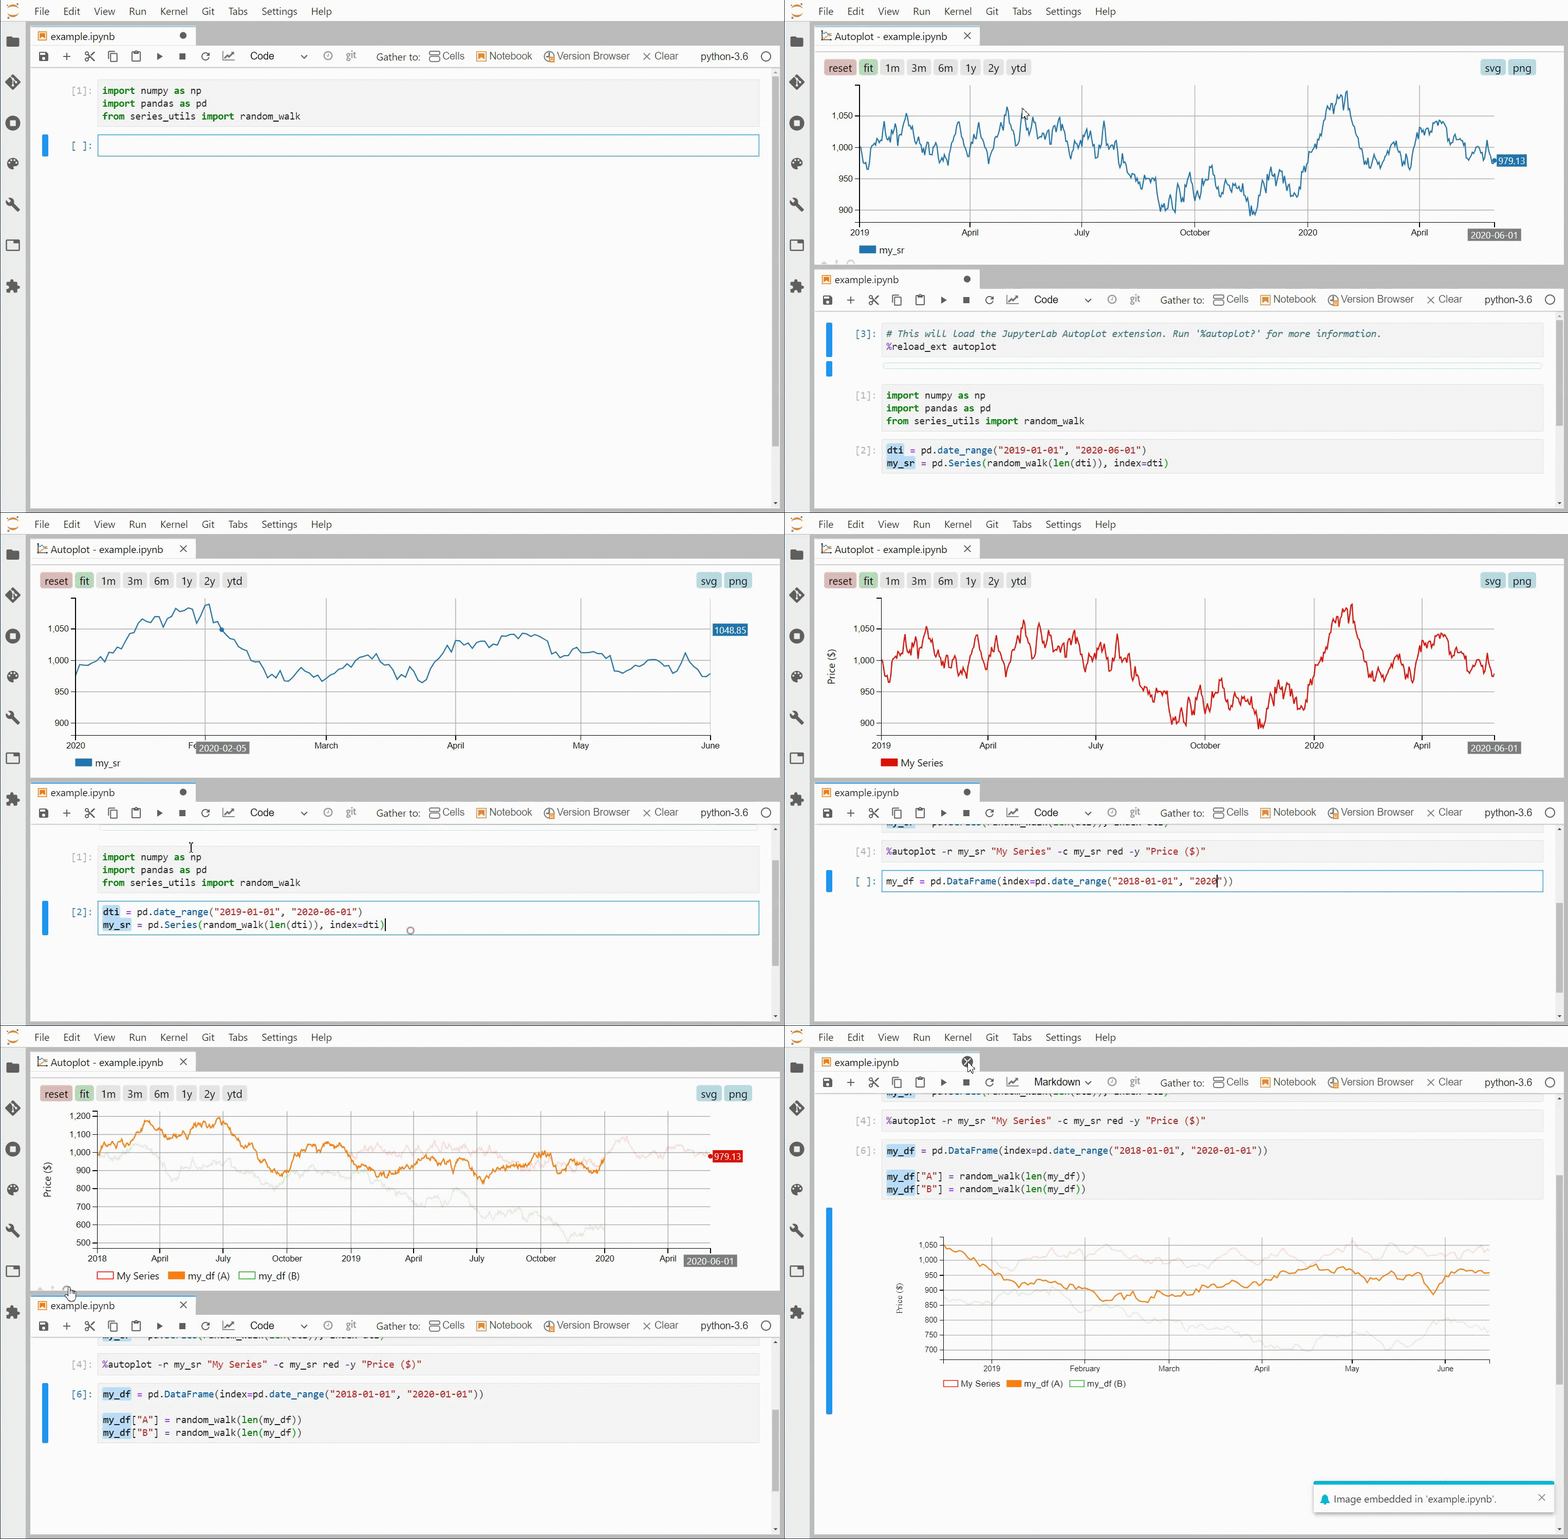
Source: Man Group.

Autoplot is helpful for anyone who likes to explore and learn quickly, anyone who requires a quick feedback loop between making a change and seeing the result, and anyone with interesting data to inspect!

If you are already using JupyterLab or JupyterHub we hope this will be an easy to use add-on which will help your workflow, and if you're not already using them then hopefully this article has inspired you to explore the great collaborative power of JupyterLab and JupyterHub.

Final thoughts

Towards the end of 2020 we open sourced another tool for JupyterLab called Man Notebooker. Man Notebooker took the concept of a sharable piece of code and turned it into a publishable and schedulable report, and we've seen great uptake of Man Notebooker both internally and externally since its creation. Having made easily sharable and publishable reports, we wanted to go back and improve the initial analysis process, which is what lead us to create Autoplot. We hope this trend of safely hiding complexity in such a way that the user can focus on their key task will continue such that many more users can get value out of Python.

As with all code and open source projects there is always more to do. Thus far our focus has been timeseries plotting (as this is our bread and butter at Man Group) but we'd love to support more chart types. We'd also like to make the interaction bi-directional - we'd like for interactions with our charts to feed back directly into the code and analysis. It's over to the open source community now to see what other ideas, use cases and improvements people dream up and contribute - happy coding!

For further clarification on the terms which appear here, please visit our Glossary page.

This information is communicated and/or distributed by the relevant Man entity identified below (collectively the "Company") subject to the following conditions and restriction in their respective jurisdictions.

Opinions expressed are those of the author and may not be shared by all personnel of Man Group plc (‘Man’). These opinions are subject to change without notice, are for information purposes only and do not constitute an offer or invitation to make an investment in any financial instrument or in any product to which the Company and/or its affiliates provides investment advisory or any other financial services. Any organisations, financial instrument or products described in this material are mentioned for reference purposes only which should not be considered a recommendation for their purchase or sale. Neither the Company nor the authors shall be liable to any person for any action taken on the basis of the information provided. Some statements contained in this material concerning goals, strategies, outlook or other non-historical matters may be forward-looking statements and are based on current indicators and expectations. These forward-looking statements speak only as of the date on which they are made, and the Company undertakes no obligation to update or revise any forward-looking statements. These forward-looking statements are subject to risks and uncertainties that may cause actual results to differ materially from those contained in the statements. The Company and/or its affiliates may or may not have a position in any financial instrument mentioned and may or may not be actively trading in any such securities. Unless stated otherwise all information is provided by the Company. Past performance is not indicative of future results.

Unless stated otherwise this information is communicated by the relevant entity listed below.

Australia: To the extent this material is distributed in Australia it is communicated by Man Investments Australia Limited ABN 47 002 747 480 AFSL 240581, which is regulated by the Australian Securities & Investments Commission ('ASIC'). This information has been prepared without taking into account anyone’s objectives, financial situation or needs.

Austria/Germany/Liechtenstein: To the extent this material is distributed in Austria, Germany and/or Liechtenstein it is communicated by Man (Europe) AG, which is authorised and regulated by the Liechtenstein Financial Market Authority (FMA). Man (Europe) AG is registered in the Principality of Liechtenstein no. FL-0002.420.371-2. Man (Europe) AG is an associated participant in the investor compensation scheme, which is operated by the Deposit Guarantee and Investor Compensation Foundation PCC (FL-0002.039.614-1) and corresponds with EU law. Further information is available on the Foundation's website under www.eas-liechtenstein.li.

European Economic Area: Unless indicated otherwise this material is communicated in the European Economic Area by Man Asset Management (Ireland) Limited (‘MAMIL’) which is registered in Ireland under company number 250493 and has its registered office at 70 Sir John Rogerson's Quay, Grand Canal Dock, Dublin 2, Ireland. MAMIL is authorised and regulated by the Central Bank of Ireland under number C22513.

Hong Kong SAR: To the extent this material is distributed in Hong Kong SAR, this material is communicated by Man Investments (Hong Kong) Limited and has not been reviewed by the Securities and Futures Commission in Hong Kong.

Japan: To the extent this material is distributed in Japan it is communicated by Man Group Japan Limited, Financial Instruments Business Operator, Director of Kanto Local Finance Bureau (Financial instruments firms) No. 624 for the purpose of providing information on investment strategies, investment services, etc. provided by Man Group, and is not a disclosure document based on laws and regulations. This material can only be communicated only to professional investors (i.e. specific investors or institutional investors as defined under Financial Instruments Exchange Law) who may have sufficient knowledge and experience of related risks.

Switzerland: To the extent this material is made available in Switzerland the communicating entity is:

  • For Clients (as such term is defined in the Swiss Financial Services Act): Man Investments (CH) AG, Huobstrasse 3, 8808 Pfäffikon SZ, Switzerland. Man Investment (CH) AG is regulated by the Swiss Financial Market Supervisory Authority (‘FINMA’); and
  • For Financial Service Providers (as defined in Art. 3 d. of FINSA, which are not Clients): Man Investments AG, Huobstrasse 3, 8808 Pfäffikon SZ, Switzerland, which is regulated by FINMA.

United Kingdom: Unless indicated otherwise this material is communicated in the United Kingdom by Man Solutions Limited ('MSL') which is a private limited company registered in England and Wales under number 3385362. MSL is authorised and regulated by the UK Financial Conduct Authority (the 'FCA') under number 185637 and has its registered office at Riverbank House, 2 Swan Lane, London, EC4R 3AD, United Kingdom.

United States: To the extent this material is distributed in the United States, it is communicated and distributed by Man Investments, Inc. (‘Man Investments’). Man Investments is registered as a broker-dealer with the SEC and is a member of the Financial Industry Regulatory Authority (‘FINRA’). Man Investments is also a member of the Securities Investor Protection Corporation (‘SIPC’). Man Investments is a wholly owned subsidiary of Man Group plc. The registration and memberships described above in no way imply a certain level of skill or expertise or that the SEC, FINRA or the SIPC have endorsed Man Investments. Man Investments Inc, 1345 Avenue of the Americas, 21st Floor, New York, NY 10105.

This material is proprietary information and may not be reproduced or otherwise disseminated in whole or in part without prior written consent. Any data services and information available from public sources used in the creation of this material are believed to be reliable. However accuracy is not warranted or guaranteed. © Man 2025