At Man Group over a third of our team are technologists, quants and data scientists. Man Group is a global, alternative investment manager, with over 35 years of systematic trading experience. We use Python as our main software development platform, and our Python Platform team is responsible for this internal environment, supporting hundreds of daily users.
Python is the most popular programming language 1 in the world with more than 10 million developers. When new package managers emerged last year claiming 10-100x performance improvements over pip, it wasn’t long before our team received a Jira ticket to investigate. The new tools highlighted that faster performance was technologically possible and would boost productivity, so one of our Platform engineers, armed with two decades of Python expertise, took the initiative to deep dive into pip to try to identify and address performance bottlenecks.
The investigation revealed surprising performance bottlenecks with significant optimisation potential.
In the end we were able to deliver significant improvements:
- 50% reduction in pip install time
- 3 times reduction in CPU usage
- 7 times faster download
Tools
The debugging was done on our standard development stack:
- Python 3.11
- PyCharm Professional
- Profiling tools from PyCharm Professional
With a set of Python packages to evaluate all aspects of pip performance:
- Torch/TensorFlow, essential ML packages for our research, are the two largest Python packages, 2 to 5 GB decompressed.
- NumPy/Pandas, essential math and data-science libraries, are large packages, 50 to 100 MB decompressed.
- Plotly, a charting library, is the largest package when it comes to file count, about 15000 files.
- Jupyter, essential for research, is a good use case to test installation of dependencies, about 80 transitive dependencies.
Profiling
We setup our development environment and kicked off the profiler. From that moment onward, the clock was ticking!
Performance Analysis
We used the profiler from PyCharm Professional.
We gave the generated trace (.pstat file) to SnakeViz for further analysis at times. SnakeViz is a free open-source tool to visualize profile trace. It’s great to get a quick overview.
Run -> Profile “myapp”-> Profile “myapp” -> click on the “Time” column to sort by total cumulative time.
Figure 1: How to run the Python profiler with PyCharm
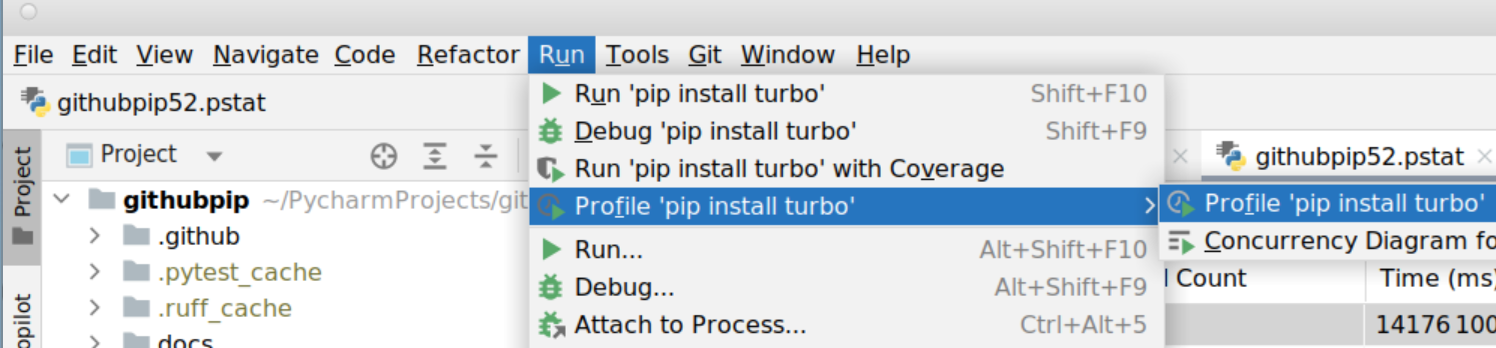
Source: Man Group.
Figure 2. Profiler output, functions view
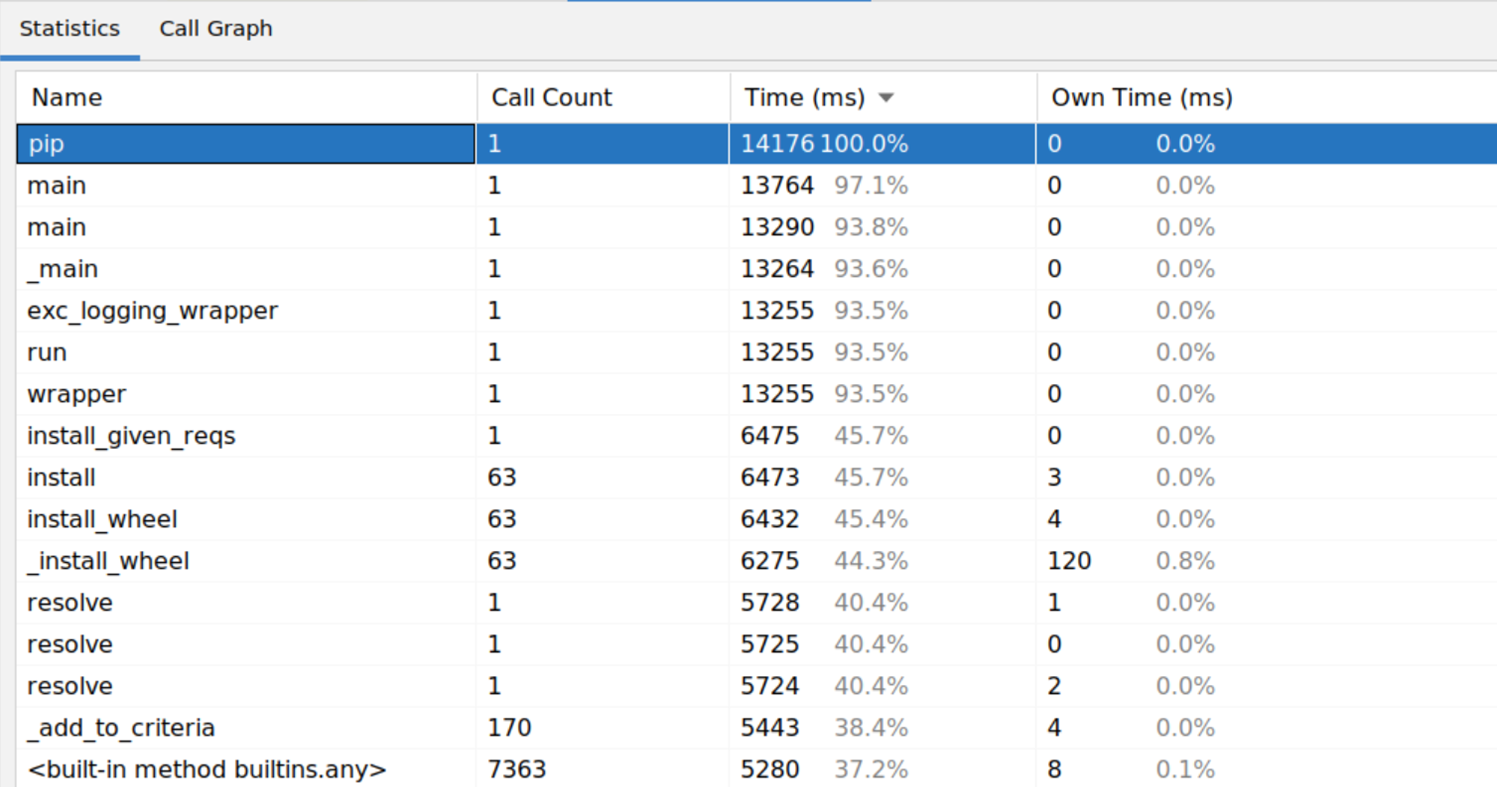
Source: Man Group.
Figure 3. Profiler output, graph view
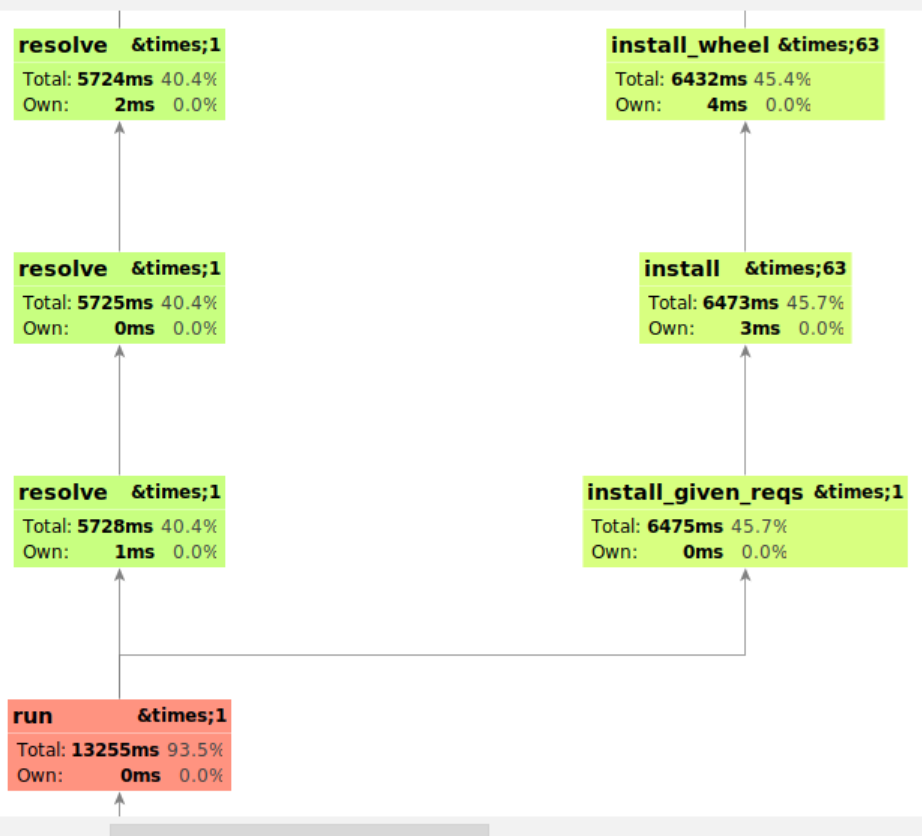
Source: Man Group.
Figure 4. Profiler output with SnakeViz
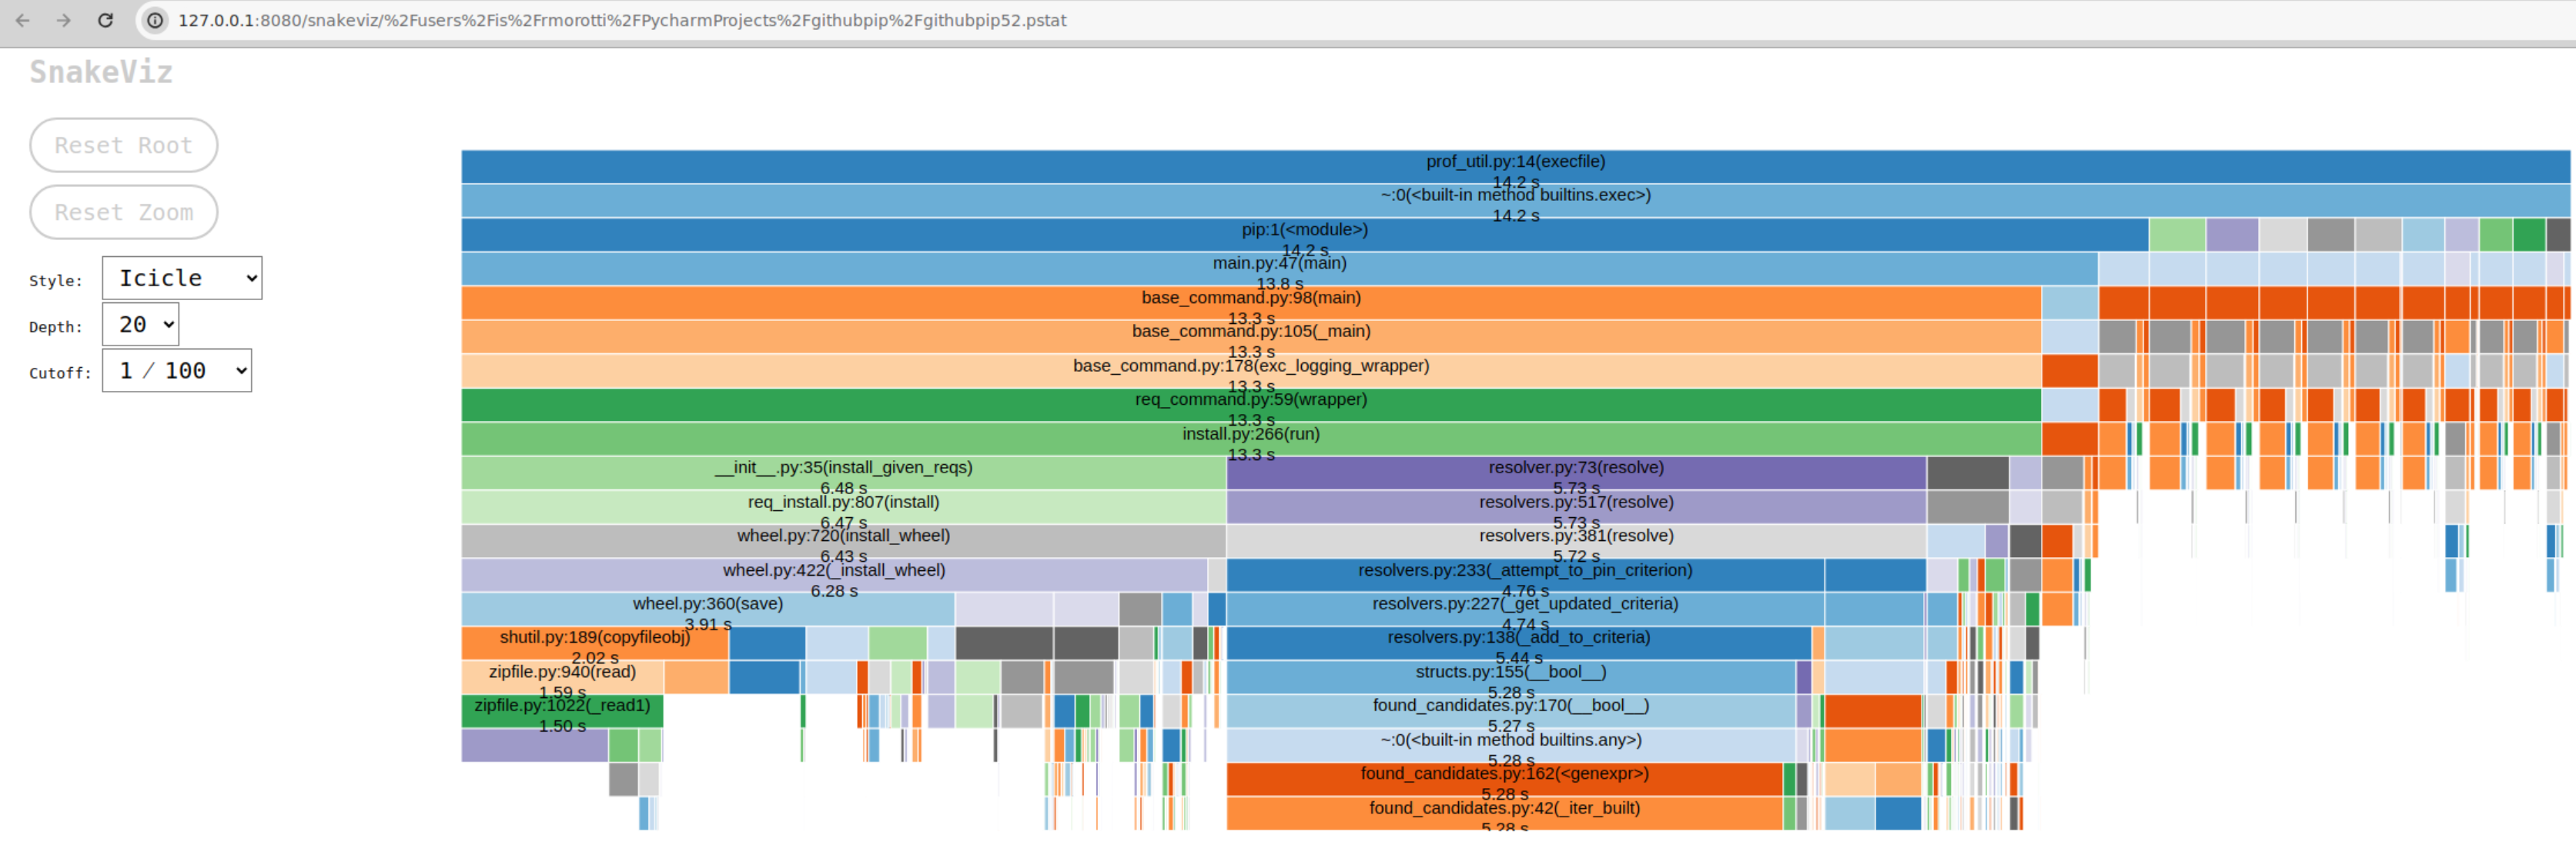
Source: Man Group.
This final chart gave a brief overview. We could see about 3 to 5 “columns”.
We ignored the orange columns on the right, it’s the interpreter startup and imports.
We focused on the blue band on the 3rd and 4th lines, “pip” and “main”:
- (green left side) 1 large column below req_install/wheel, probably the code to extract the wheel.
- (purple middle) 1 large column below resolvers/found_candidate, probably the code to resolve dependencies.
- (mix in the middle to right) a few small columns below the install toward the right and below the main toward the right.
We found ourselves in the worst-case scenario. The run time was fragmented between multiple critical paths (download, resolution, extraction). Even if we optimised one part of pip to make it 10 times faster, pip as a whole will not get 10 times faster.
The more perplexing problem… where was the download code? In principle a package manager is downloading and extracting packages. The download code should be very noticeable.
Investigation revealed the download is done during the dependency resolution. pip can only discover dependencies after it has downloaded a package, then it can download more packages and discover more dependencies, and repeat. The download and the dependency resolution are fully intertwined.
That promised a challenge.
Key improvements:
We first identified an issue with directory creation. On a run of "pip install --no-deps plotly", the installation made 14000 calls to make directories.
The package had 14000 files. pip was recreating the parent directory before extracting each file.
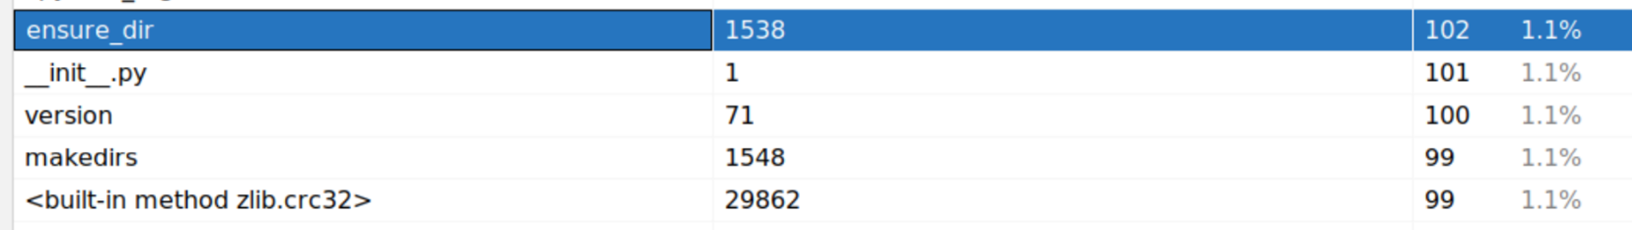
Figure 5. Profiler output
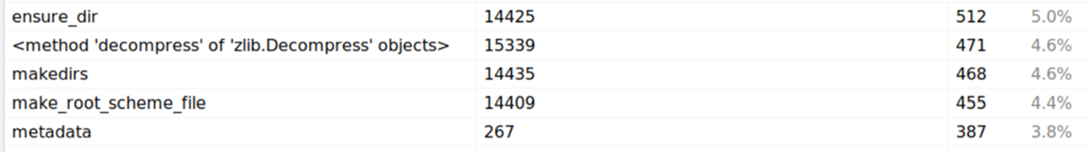
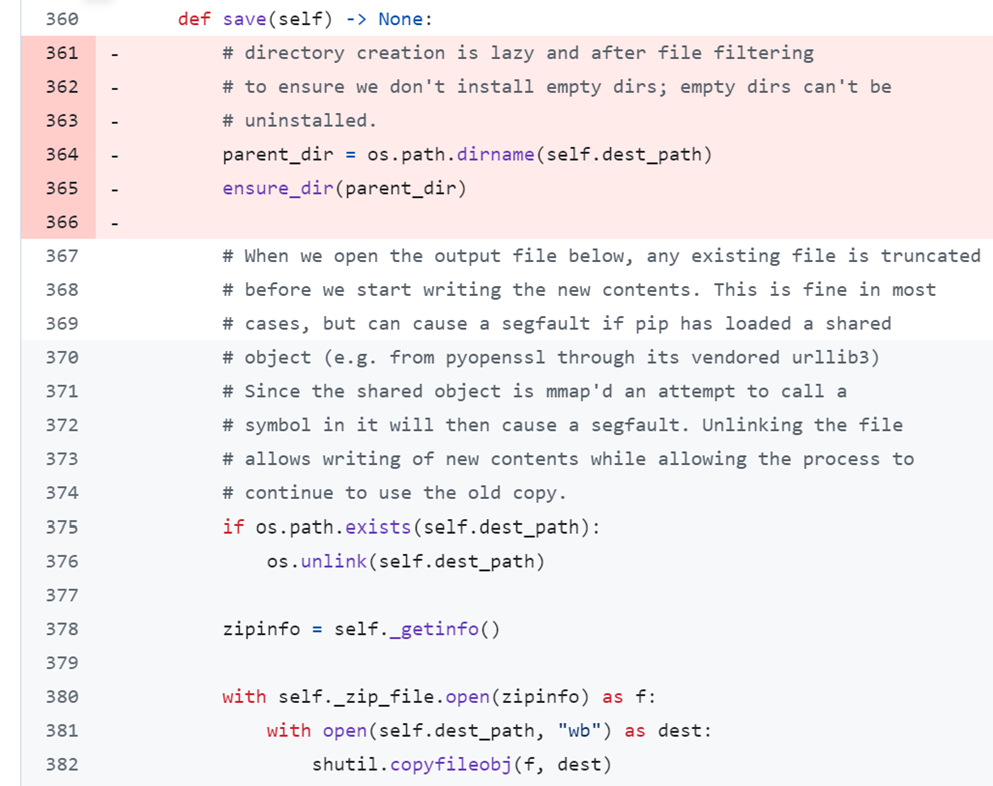
Figure 6. pip source code
The fix was simple. pip should create the directory structure once. The fix reduced the calls by 90%: 14425 down to 1538.
PR #1: Make pip 5% faster by not recreating the parent directory when extracting each file https://github.com/pypa/pip/pull/12782/files
Source: Man Group.
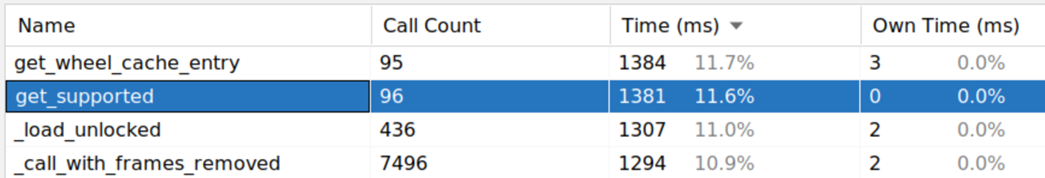
The profiler highlighted a long run time in the get_supported() function, to return supported tags.
What are tags in pip? Tags identify the running platform and ensure that only compatible packages are installed.
Python packages have a filename like “numpy-1.18.5-cp38-cp38-manylinux1_x86_64.whl” or “requests-2.27.1-py2.py3-none-any.whl”. This NumPy package can only run on Python 3.8 on a Linux distribution with glibc 2.17 or newer (CentOS 7, Debian 8, Ubuntu 14).
You can probably think of a few variants of operating system and Python version. Simple in theory, but quite complex and expensive to compute in practice. A simple call to `pip._internal.utils.compatibility_tags.get_supported()` found 889 tags supported on our development machine.
Why was the profiler highlighting tag functions? pip was identifying the current platform again for each new package when it should only be done once per run.
By coincidence, a developer noticed this bug and raised a PR (Pull Request) to fix it 3 weeks earlier. We updated the PR with more information, and it was merged shortly thereafter.
PR #2: Make pip 17% faster by identifying the platform tags only once for the run https://github.com/pypa/pip/pull/12755
Next the profiler uncovered a performance issue in the console output.
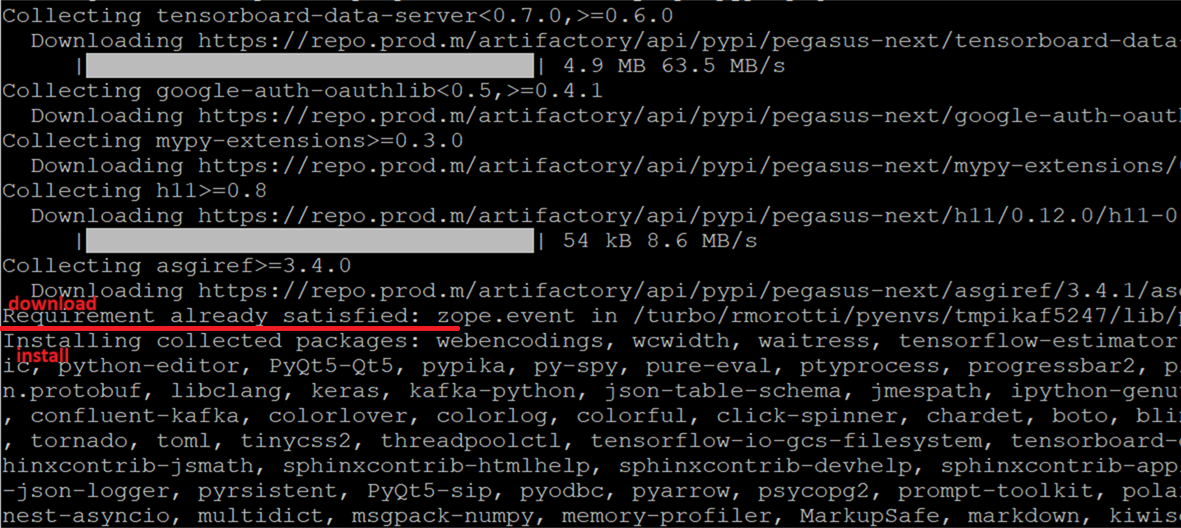
During a pip run, pip printed large volumes of output while downloading packages, then pip blocks for minutes without any output (on the red line) while installing packages, then pip finally displayed a summary of what was installed.
We always assumed the pause with no output was busy extracting packages. It takes whole minutes to extract hundreds of packages (tens of thousands of files).
Figure 7. Example of pip output
The profiler showed that pip was busy in this code.
Figure 8. pip source code
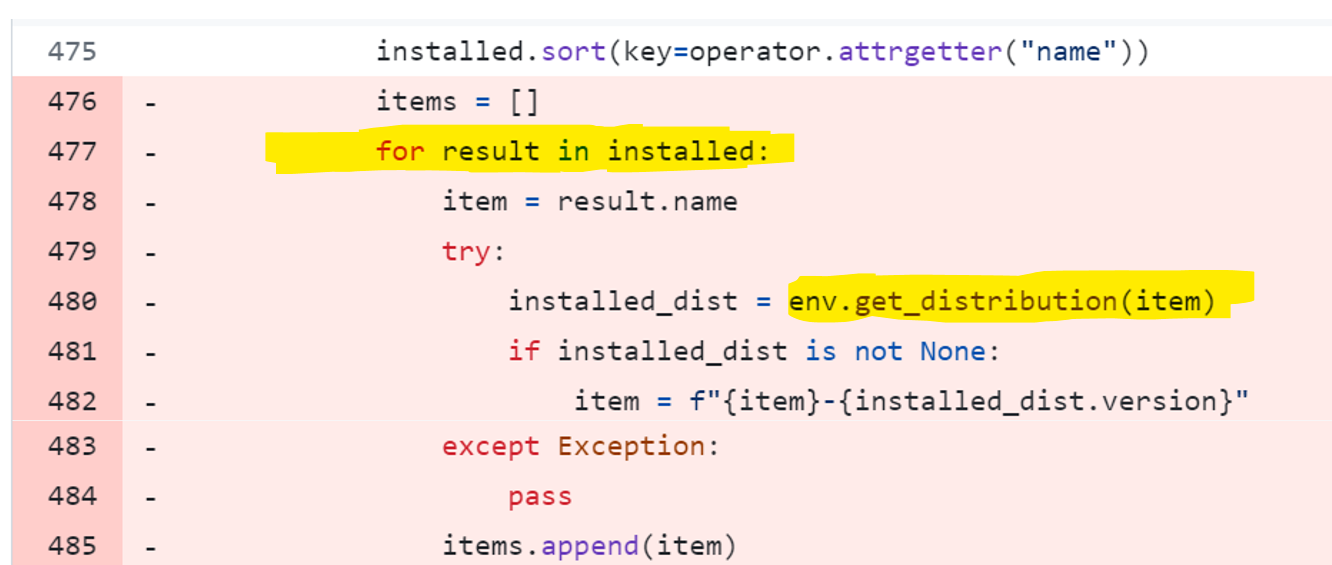
This was the code to sort installed packages just before the final print.
There was a quadratic performance bug lurking in that code. The function `env.get_distribution(item)` to fetch the package version that was just installed was not constant time, it looped over all installed packages to find the requested package.
We always thought that pip was busy extracting packages. Actually pip was busy preparing the final summary of installed packages.
We were very curious at the actual impact of this bug. In theory it had to consume more CPU quadratically with the number of packages to install… until the whole run was mainly waiting for the final summary to print?
Figure 9. Measuring installation time vs print time
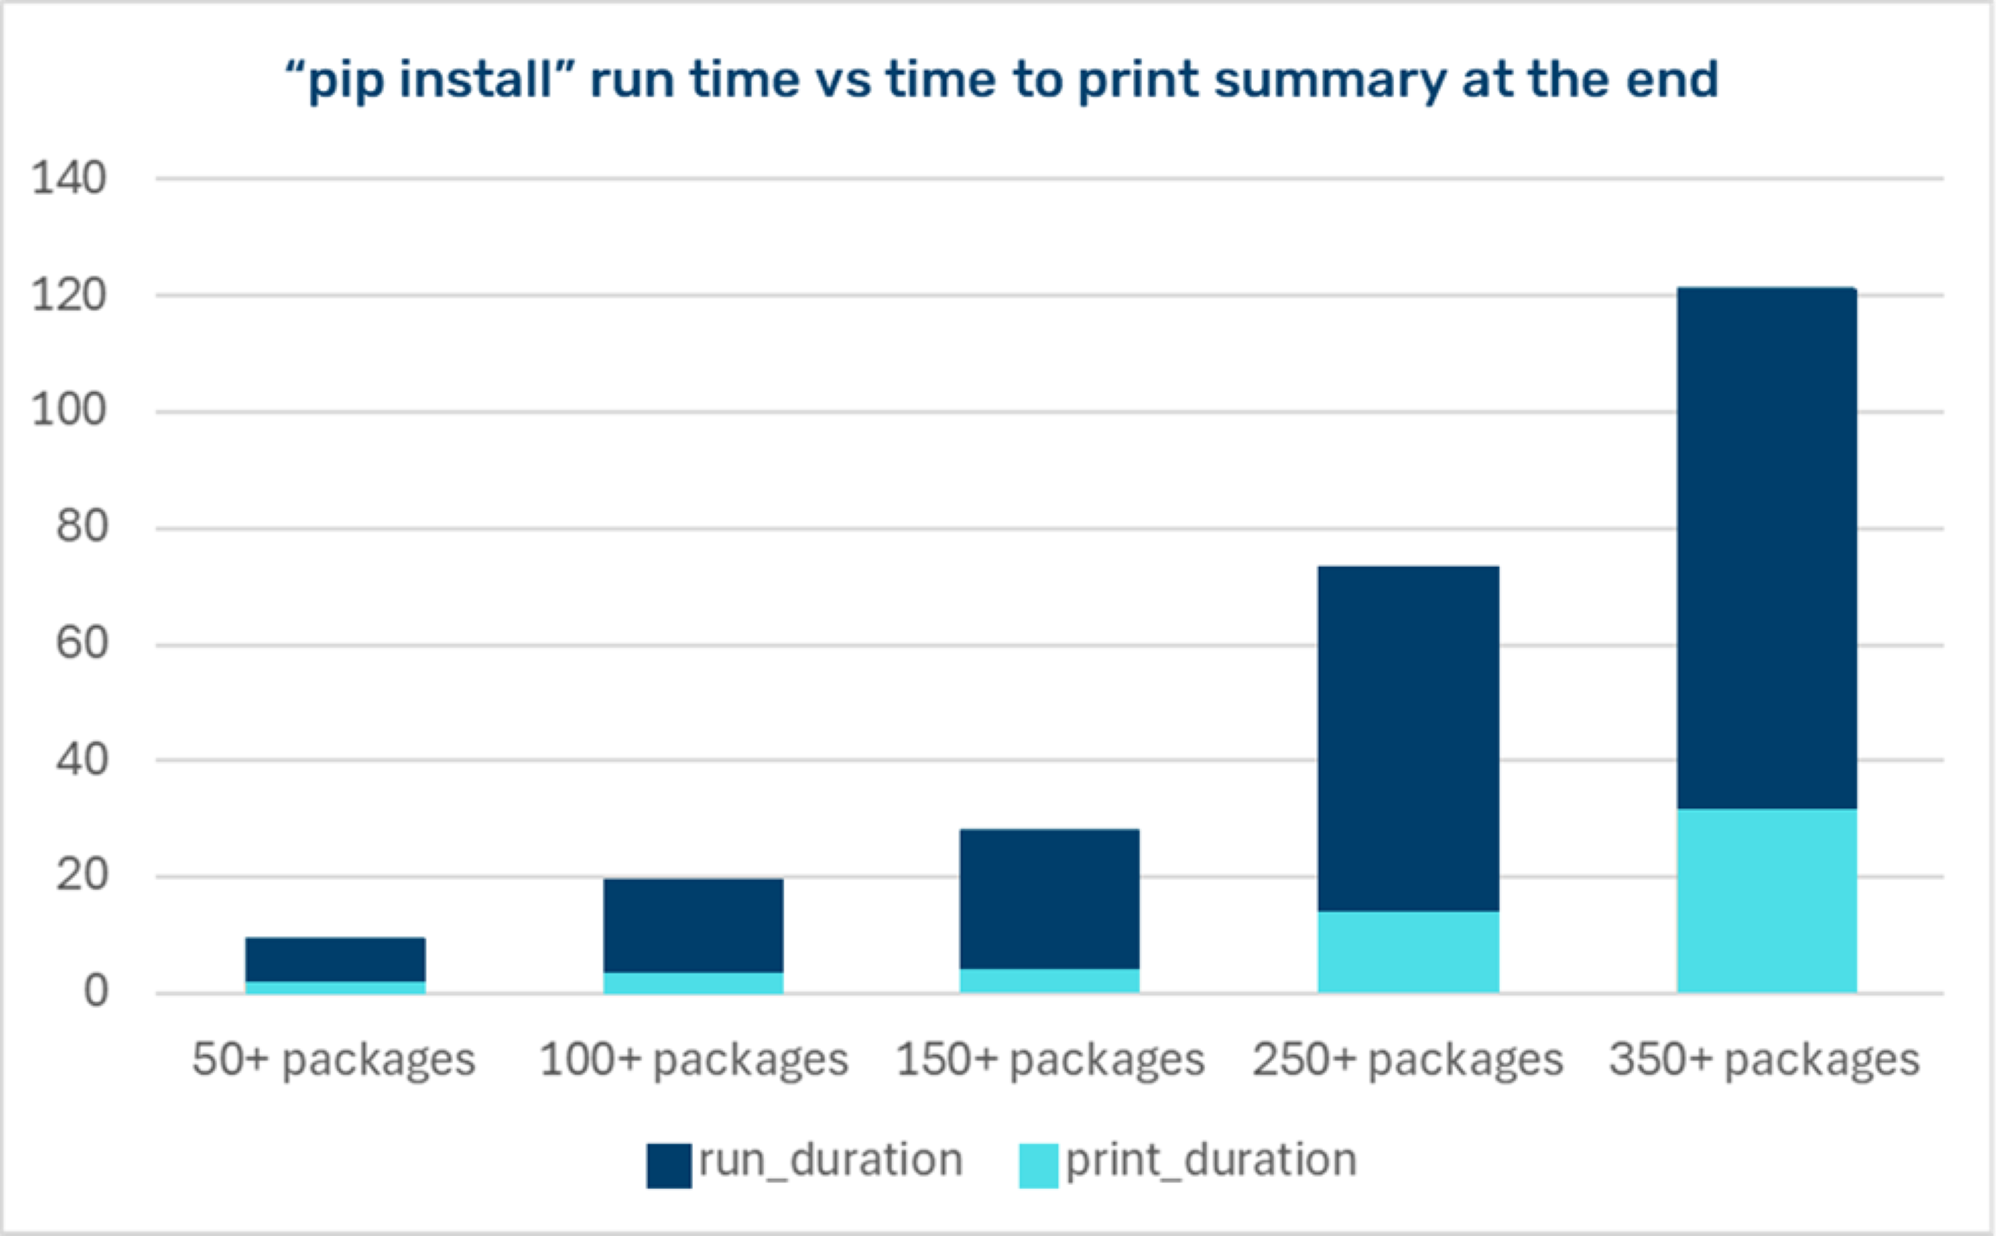
We measured the impact across various virtual environments. As we approached 300 packages, about 30% of the pip runtime was taken to print the final summary.
We rewrote the code to print the summary and sent a PR.
PR #3: Optimise logic for displaying packages at the end of pip install
https://github.com/pypa/pip/pull/12791
The profiler guided us to the extraction code. That’s where we just fixed the code that was recreating the parent directory.
Figure 10. Profiler output
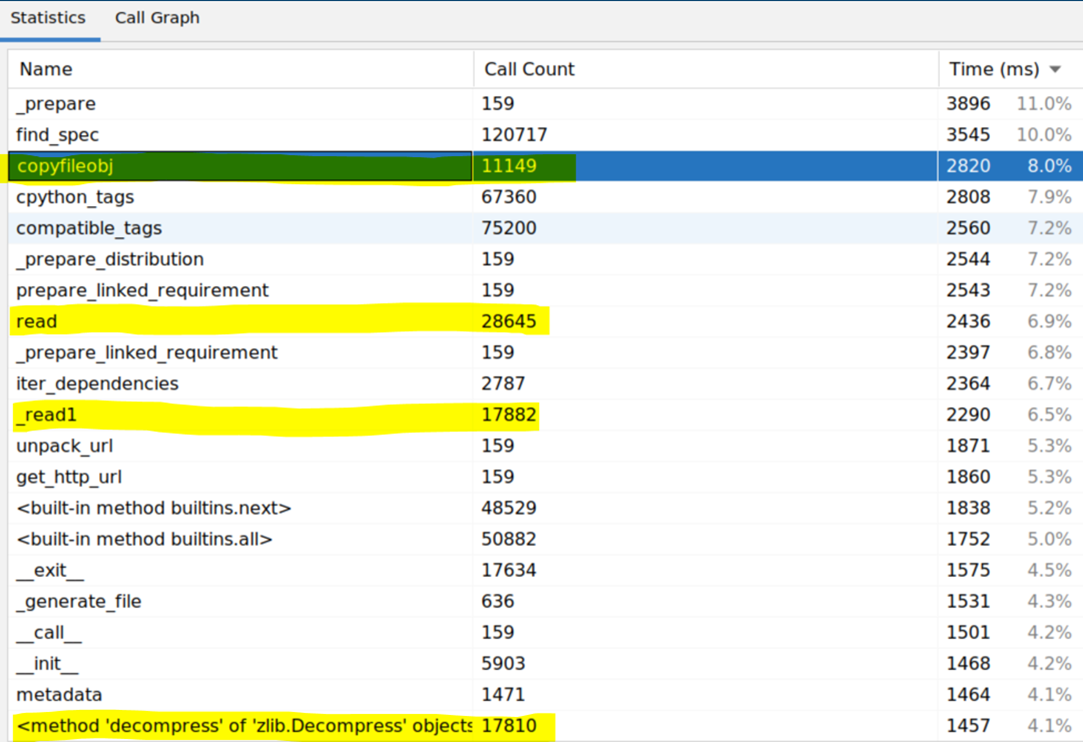
Figure 11. pip source code, save() function
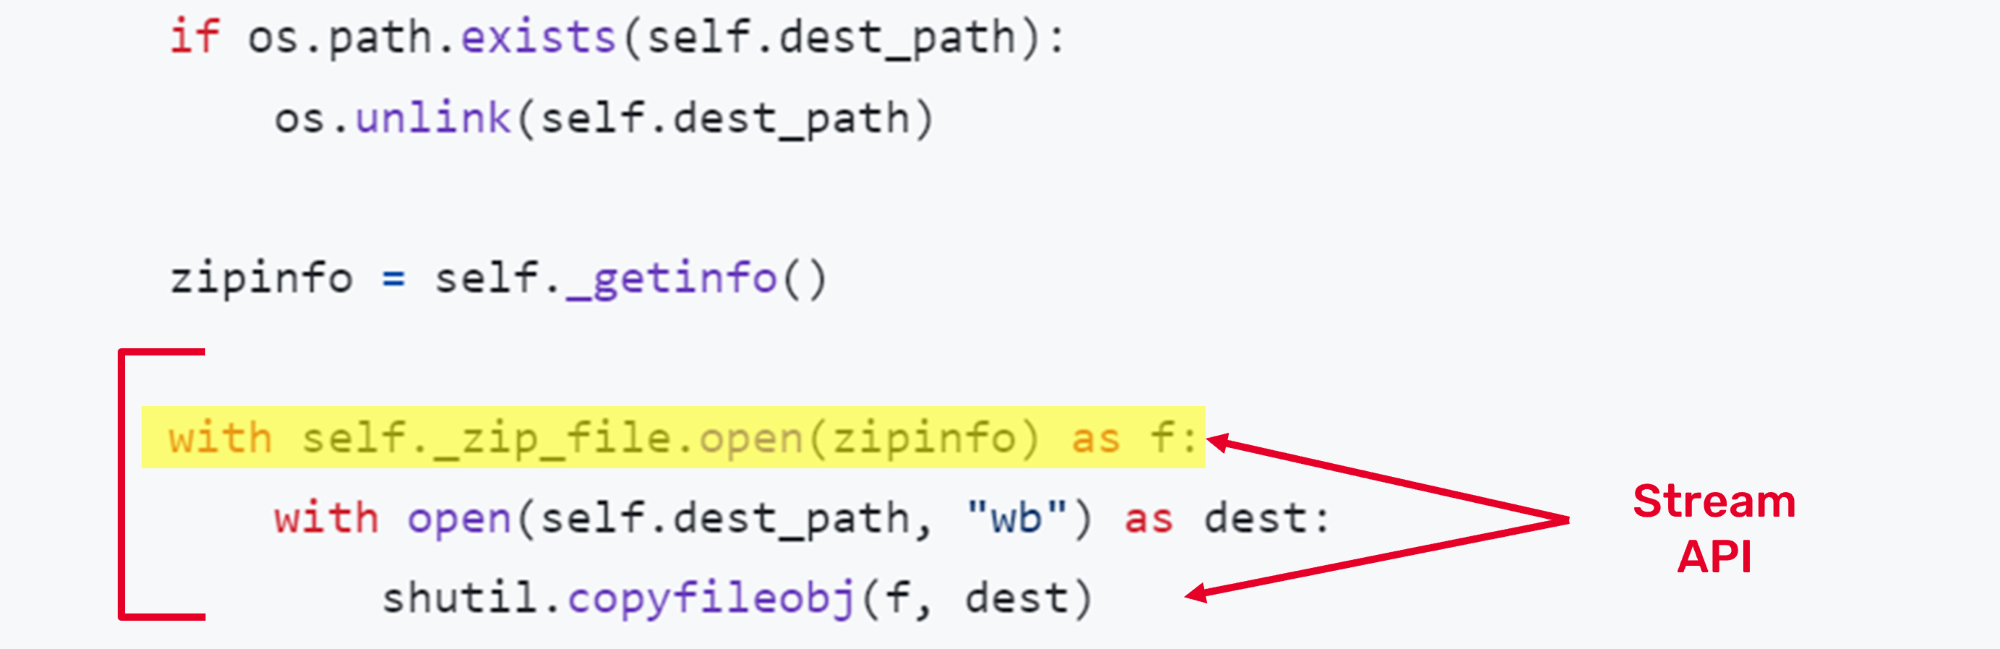
It was the code that extracted each file from within the zip file (a wheel package is a zip file).
Have a look at these 3 lines of code doing the extraction. It’s a beautiful example of Object-Oriented Programming in action.
The zip file class operates like a standard file. The extraction code is reading the file from within the zip file as if it were a real file, the content is decompressed and decrypted and checksumed on the fly. It’s beautifully simple.
We spent a lot of time looking into the zip file standard library and how it worked:
- It does repeat read/seek/open to locate headers and content, which is unnecessary.
- It acquires a read/write lock on every operation, which is unnecessary.
- It’s a stream API operating on blocks of bytes. It has no concept of file size or boundary.
- It’s decompressing in small blocks (few kilobytes), which is inefficient.
- It has no awareness of the compressed size or the expected decompressed size to perform the extraction. There is no capability to give any hint.
We attempted to rewrite some of it to see what may be possible. The extraction could be made 20% to 30% faster.
Unfortunately, the zip file class was part of the Python interpreter, far outside of the scope of pip. We opened a discussion on pip to see what the consensus was before spending more time on this. One of the maintainers said they could vendor a zip file library, if there was a faster alternative to the standard library that provided the same guarantees.
Ultimately, we made a PR with what could be reasonably optimised in pip itself.
Figure 12. #minimal hacks that can pass a code review, 10% performance
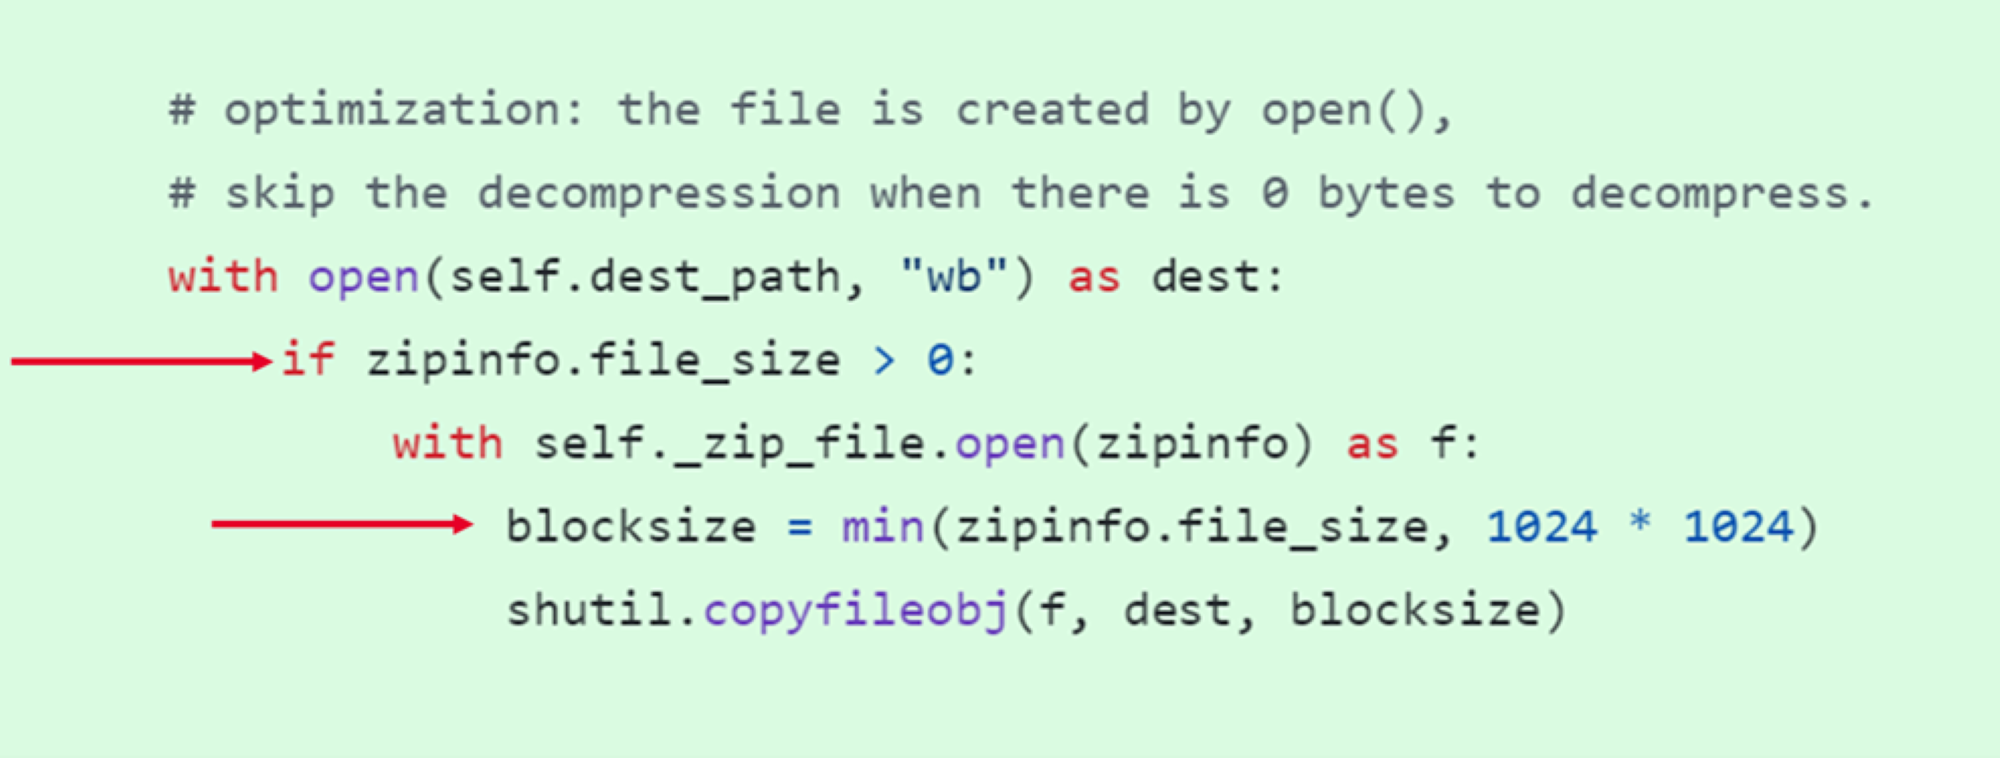
One neat trick to skip decompression of 0 bytes files. This tiny change had a sizable impact because Python packages typically have 5% to 10% of empty init files.
We set the block size to the file size for small files. It allowed most files to be decompressed in a single operation.
PR #4: 10% faster pip install, optimize extraction, extract files from wheel in 1MB blocks + skip decoding for 0 bytes files https://github.com/pypa/pip/pull/12803
Once extraction was optimised, we turned our attention to download code.
At 2 GB to download, torch was the biggest package in the Python ecosystem, often bigger than every other package combined.
The download of torch had a noticeable impact on our builds. It took 30 seconds to download at 60 MB/s.
Figure 13. Screenshot of pip download on my machine

Figure 14. Profiler output, “pip download --no-deps torch”
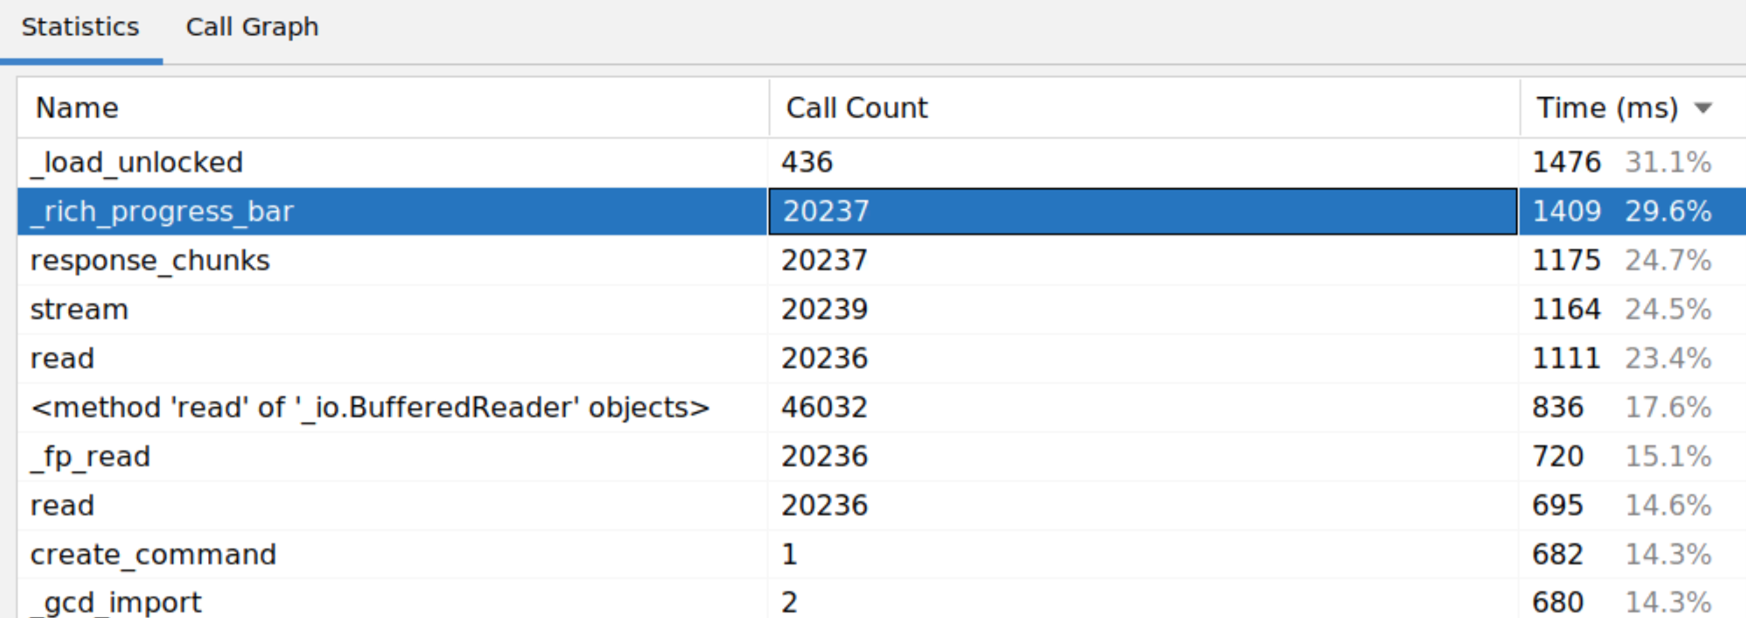
Rich is a framework to display progress bars. read() and stream() are I/O functions spread across openssl/urllib/requests/pip.
The pip code was using a special request stream API to download. The rich callback function was called with a chunk of bytes, it updated the progress bar and forwarded the chunk to the next function.
Notice 20237 calls across read functions! There is a performance bug in the requests library (the main HTTP library in Python), it downloads in small chunks of CONTENT_CHUNK_SIZE=10240 bytes by default, which is slow and inefficient.
https://github.com/psf/requests/blob/c4c8e20289ab82edad55d2fc07b42cbf08ae1441/src/requests/models.py#L80
The fix was straightforward. Set the chunk size when using requests. Try 256 KiB for HTTP requests. We were able to increase the download speed from 60 MB/s to 260 MB/s with better tuning and we opened a PR.
The reviewers pointed out that there was code to configure the rich progress bar. It was configured to refresh up to 30 times a second. We had a deep look into the progress bar settings and how it was rendered with rich. The rendering of the progress bar was as much as 30% of the run time!
With fine tuning, we were able to increase the download speed from 60 MB/s to 460 MB/s.
PR #5: optimize the download code, did you know the progress bar was 30% of the runtime! https://github.com/pypa/pip/pull/12810
We obtained new machines for artifactory - our internal Python package repository - and for developers since then, pip can download at an average speed above 600 MB/s to /tmp.
Figure 15. Screenshot of pip download on my machine

Continuing our investigation, we discovered that 5% of the pip runtime was spent fetching proxy environment variables.
Performing a run of “pip install jupyter”, jupyter installed 63 dependencies.
Figure 16. Profiler output
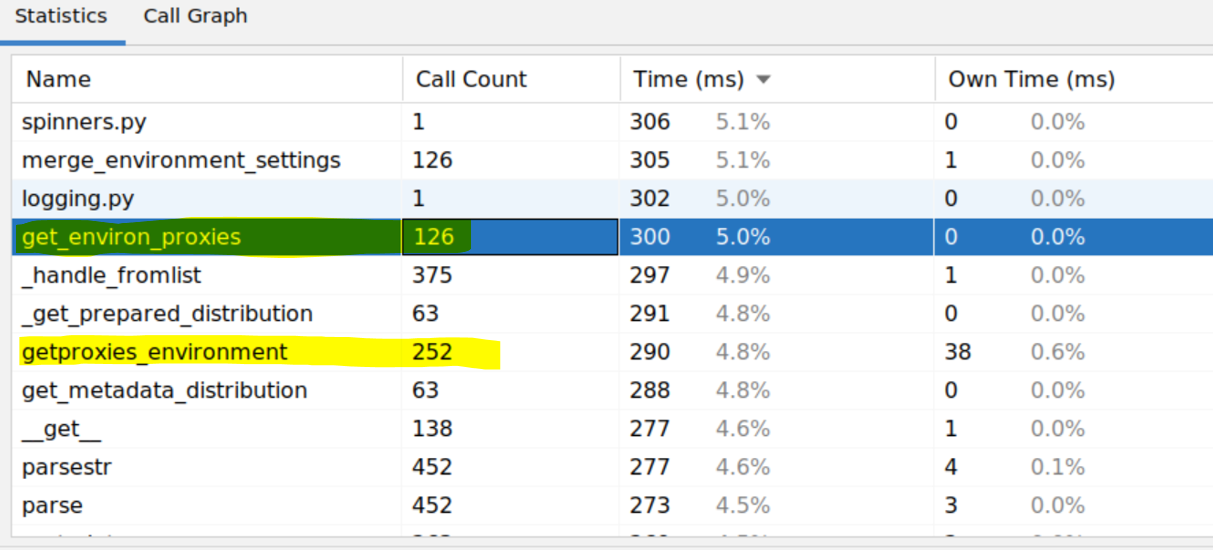
Notice how the number of calls was doubling: 63 calls to get_metadata_distribution() + 126 calls to get_environ_proxies() + 252 calls to getproxies_environment().
Many developers working in a corporations may need to configure proxies for external network access. There are 3 environment variables to set for a HTTP Proxy:
-
HTTPS_PROXY=http://proxy.example.com:8128
-
HTTP_PROXY=http://proxy.example.com:8128
-
NO_PROXY=internal.mycompany.com
It shouldn’t take long to read 3 variables.
We were onto something. The profiler found multiple optimisation opportunities in the Python interpreter (urllib is part of the interpreter). See urllib.requests.getproxies_environment() in Python 3.11 https://github.com/python/cpython/blob/3.11/Lib/urllib/request.py#L2499
All together:
- requests fetched proxy settings on every request
- it fetched proxy settings twice, PROXY and NO_PROXY environment variables
- it fetched all environment variables twice, PROXY uppercase and proxy lowercase
- urllib fetched the name and the value of every environment variable, although the value is only needed for matches
We were not the first ones to notice the performance issue. Another person sent a PR first to the Python interpreter.
PR #6 https://github.com/python/cpython/pull/91566/files and discussion https://github.com/python/cpython/issues/91539.
The fix in the interpreter improved getproxies_environment() to iterate over environment variables only once and fetch the value only for matches.
It’s about 5x faster to fetch proxy settings. This was merged into Python 3.12. It’s a fantastic example of a big improvement you can get when upgrading the platform.
Most Python developers would not expect that `requests.get()`might take longer reading proxy environment variables than actually downloading data.
Our profiler revealed that 7% of the runtime was spent in fsync. Two calls per installed package.
Figure 17. Profiler output

Figure 18. pip source code
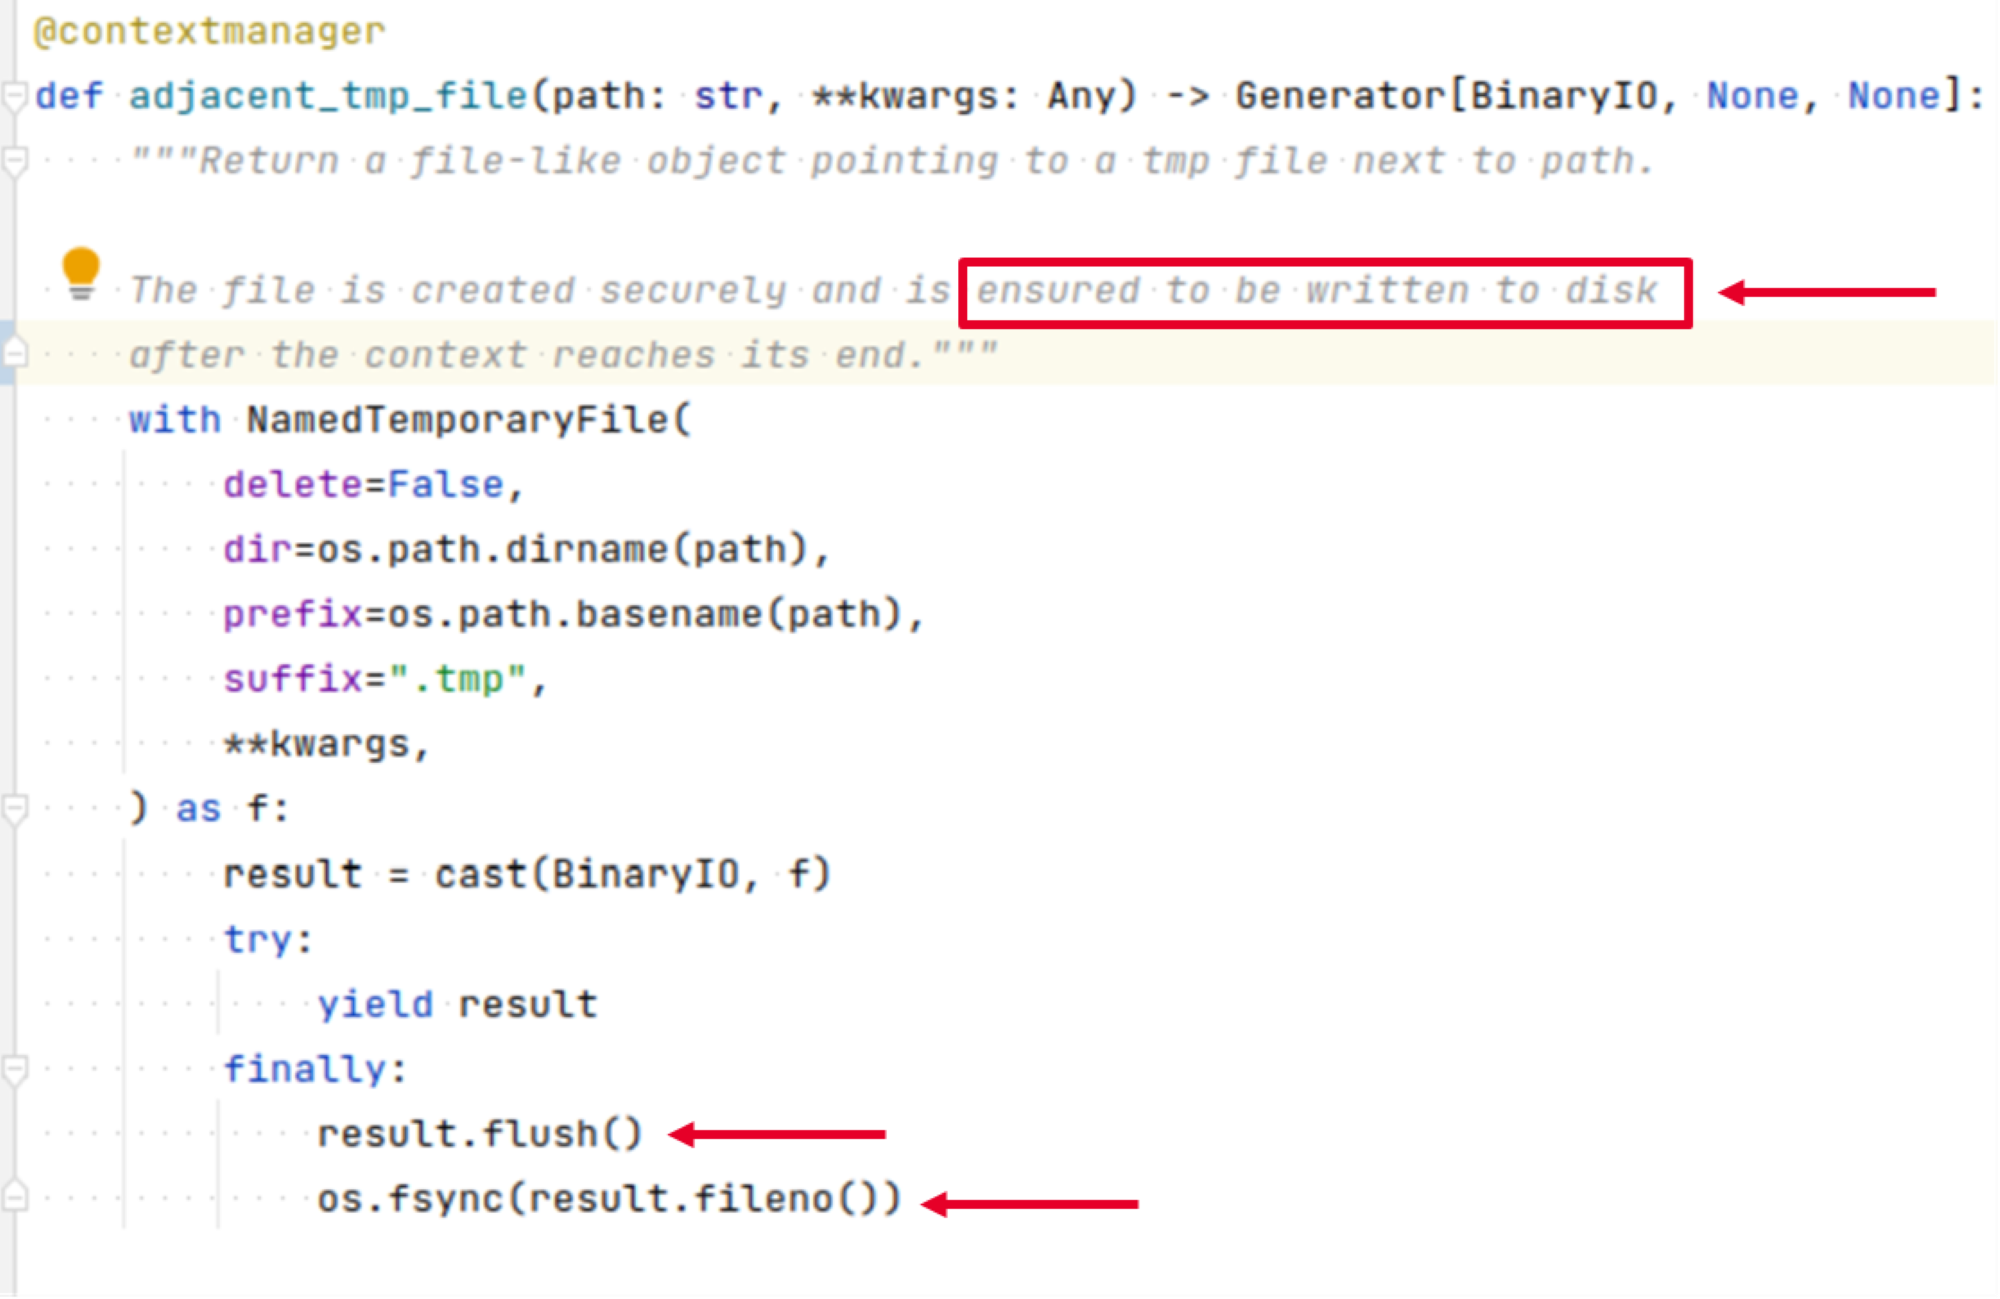
Debugging this decade old code required some detective work. The person who wrote this code really wanted the file to be written. Why?
We added print statements to discover what called this code.
Figure 19. Run with extra print statements for debugging
# run of "pip install jupyter"
adjacent_tmp_file(…/jupyter-1.0.0.dist-info/INSTALLERwavpz1se.tmp flush 0.000ms (cumulative 0.006)
adjacent_tmp_file(…/jupyter-1.0.0.dist-info/INSTALLERwavpz1se.tmp fsync 0.004ms (cumulative 0.415)
adjacent_tmp_file(…/jupyter-1.0.0.dist-info/RECORDowdvn2x6.tmp flush 0.000ms (cumulative 0.006)
adjacent_tmp_file(…/jupyter-1.0.0.dist-info/RECORDowdvn2x6.tmp fsync 0.003ms (cumulative 0.418)
flush() was instantaneous while fsync() was always a few milliseconds (3 to 7 ms). That was very surprising.
There were two files written per package:
- The RECORDS file holds information about the package and every file installed by the package. This explains why the developer went above and beyond to ensure it’s written. It’s very important.
- The INSTALLER file is a useless file that always contains the string “pip”. It’s very useless.
We believe that pip was initially writing the RECORDS file in place many years ago and it did a fsync to ensure the content was written. Later, the function was re-used for new metadata files (INSTALLER).
At some point, the function was rewritten to perform an atomic rename but the fsync remained. We think the fsync is no longer necessary.
We raised a PR to remove the call to fsync.
PR #7: faster pip install, remove unnecessary calls to fsync https://github.com/pypa/pip/pull/12859
Unfortunately, the PR was not merged. It opened debates about fsync behaviour across operating systems.
Finally, we found one little function get_requirement consuming 5% of the runtime. A small function to parse and cache requirements strings.
Figure 20. Profiler output
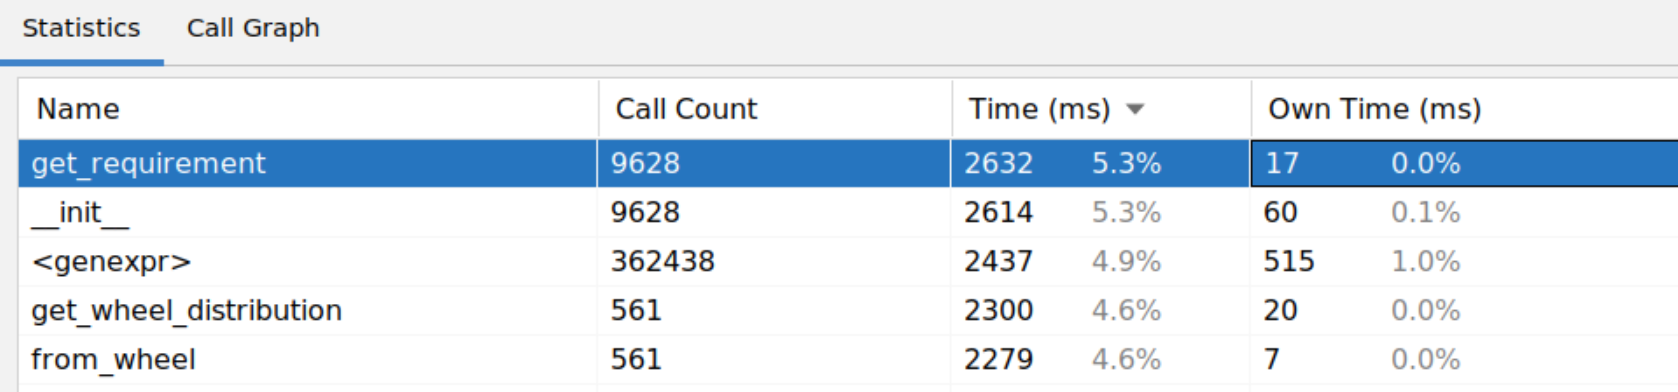
Figure 21. pip source code
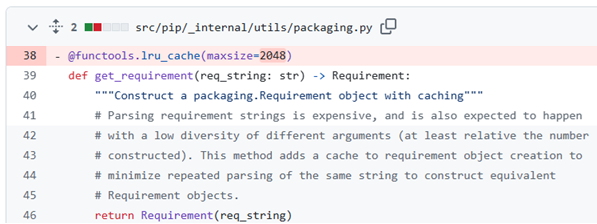
Requirements strings are the dependencies of a package. Dependencies are specified in the `xxx-distinfo/METADATA` file within a package.
Figure 22. Example of metadata
# content of requests-2.31.0.dist-info/METADATA
Name: requests
Version: 2.31.0
...
Requires-Python: >=3.7
Requires-Dist: charset-normalizer (<4,>=2)
Requires-Dist: idna (<4,>=2.5)
Requires-Dist: urllib3 (<3,>=1.21.1)
Requires-Dist: certifi (>=2017.4.17)
Provides-Extra: security
Provides-Extra: socks
Requires-Dist: PySocks (!=1.5.7,>=1.5.6) ; extra == 'socks'
Provides-Extra: use_chardet_on_py3
Requires-Dist: chardet (<6,>=3.0.2) ; extra == 'use_chardet_on_py3'
Requirements strings were surprisingly expensive to parse. There was already a lru_cache around the function. It was a known issue.
We doubled the size of the cache to see what happened… it took half the time!
The cache was too small. The state of the cache could be debugged and tuned with `print(get_requirement.cache_info())`:
- CacheInfo(hits=4311, misses=10760, maxsize=2048, currsize=2048) with maxsize set to 2048
- CacheInfo(hits=9129, misses=5942, maxsize=8192, currsize=5756) with maxsize set to 8192
PR #8: faster pip install, raise the cache to parse requirements string, the cache was too small https://github.com/pypa/pip/pull/12873
There were a few more patches to make pip and Python more awesome.
The article being long enough, we decided to stop here.
Final Benchmark
The cumulative impact of our optimisations is staggering:
- pip install is twice as fast compared to earlier versions
- pip download is 7 times faster
- pip CPU usage is reduced by 3 times. The slower the CPU the more improvements you will notice
Figure 23. pip install time
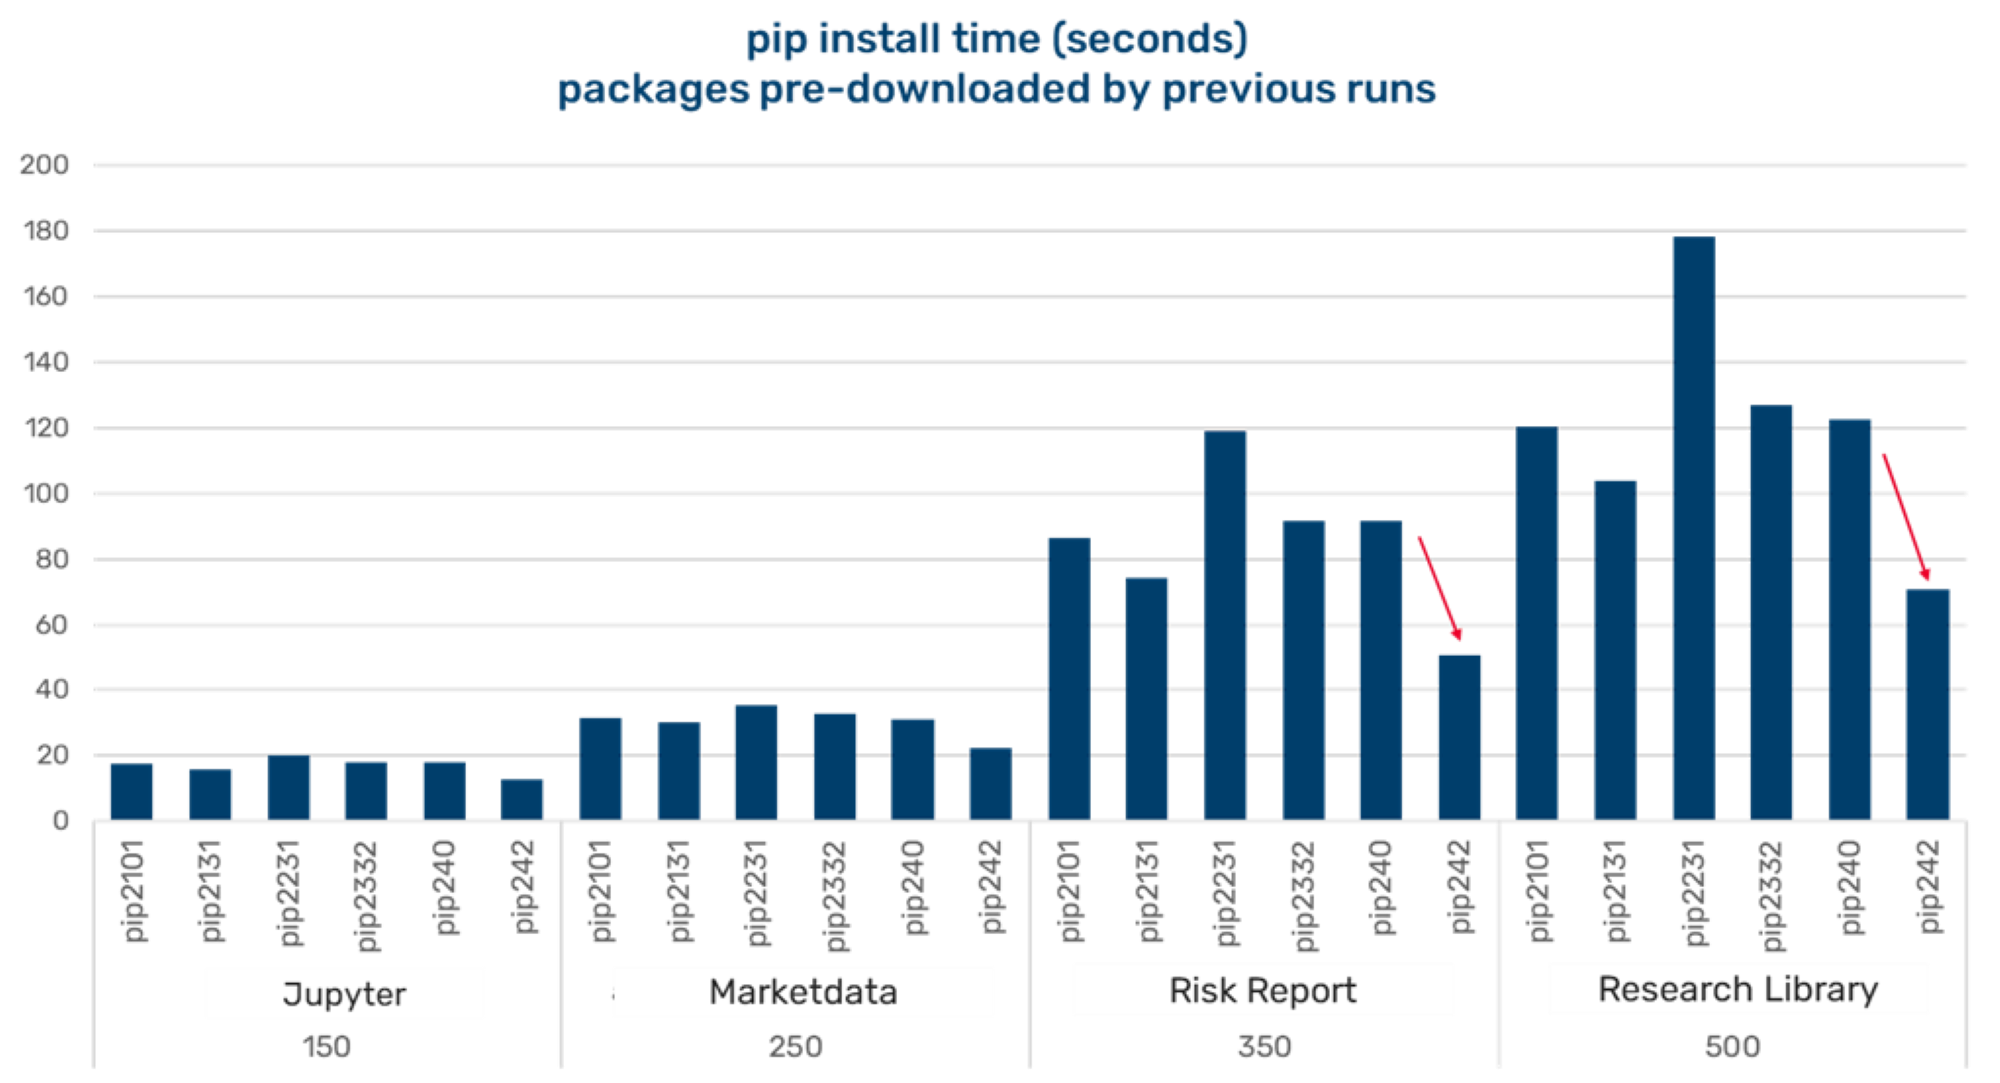
Figure 24. pip install time. blue is elapsed, cyan blue is user CPU, pink is system CPU
.png)
Breakdown of CPU usage with the time command.
Note: Packages are cached by previous runs, this is not exercising the download code that is seven times faster.
Conclusion
We took a deep-dive into pip for a week and it went pretty well! 😊
We have dramatically improved the experience for our internal developers and researchers when setting up new environments. It has also noticeably reduced the overheads in our CI/CD build system.
We were asked how long it took when we presented these results internally. Discovering most of these issues and developing patches took about 2 weeks. Getting the PRs raised and merged took a further 2 months.
These contributions are a great example of the power of open-source software. Small targeted improvements, which are relatively simple to implement, can be instantly released to the collective benefit of millions.
We hope this inspires others to seek performance gains. There is an breadth of improvements waiting to be discovered, even in well-established products such as pip and the Python interpreter.
Many thanks to the contributors who reviewed and approved the PRs. Particular thanks to https://github.com/ichard26 and https://github.com/notatallshaw who were very active on pip and contributed a few other fixes.
Give the article a like. Ping a birthday cake emoji to celebrate my 20th year of Python 🎂.
If you work in a corporate environment, post a comment with how fast you can run “pip download” on your internal mirror!
“cd /tmp && pip download --no-deps --no-cache torch”
You are now leaving Man Group’s website
You are leaving Man Group’s website and entering a third-party website that is not controlled, maintained, or monitored by Man Group. Man Group is not responsible for the content or availability of the third-party website. By leaving Man Group’s website, you will be subject to the third-party website’s terms, policies and/or notices, including those related to privacy and security, as applicable.