Introduction
The pre-pandemic economic cycle in the US was the longest since records began. Lasting 146 months from December 2007 until February 20201, it seemed like the bull market would never end – until it was brought to a shuddering halt by the onset of Covid-19.
Even though this current cycle is barely two years old, we nevertheless see storm clouds on the horizon. This paints a more difficult backdrop for high yield credit or indeed, credit as a whole.
Although the pandemic certainly ended one economic cycle and began another, the Covid-inspired downturn was relatively brief. In the wake of the economic downturn, massive monetary stimulus and fiscal bailouts muted the credit cycle and limited the number of defaults. Within two months, the US economy was expanding and the cycle began again.
Even though this current cycle is barely two years old, we nevertheless see storm clouds on the horizon. Inflation continues to run hot, accelerated by the invasion of Ukraine. To fight it, the Federal Reserve is committing to hiking interest rates, which is usually enough to end most economic expansions. Global debt is at unprecedented levels. Yet, undaunted by the prospect of rising rates, animal spirits are surging, with new records of leveraged finance issuance being set. And economic growth is starting to stutter.
In our view, this paints a more difficult backdrop for high yield credit or indeed, credit as a whole: the end of accommodative monetary policy, a growing stock of debt and slowing economic growth to finance it all. We therefore might not just be facing a recession, but the end of credit cycle as well.
Credit After the Pandemic
A normal economic cycle tends to roughly follow a pattern: corporate earnings grow as demand increases; employment increases; demand eventually outstrips supply causing inflation, which increases unit labour costs and depresses corporate margins; central banks raise interest rates to combat inflation; higher rates increase the cost of capital and cause high yield spreads to blow out; defaults occur, joblessness spikes, and the cycle comes to a close. This cycle normally takes some years to play out.
However, the first thing to note about the current cycle is that it has been exceptionally compressed. The recession caused by the Covid-19 pandemic was far shorter than previous recessions, lasting only two months. The pandemic imposed an artificial constraint which materially accelerated the cycle: supply chain bottlenecks. Demand may not necessarily be much higher than a few years ago, but with supply constrained, even normal levels of demand are swamping the supply of available goods. The inflationary spike that precedes the beginning of the end for a cycle has therefore been brought much closer. This is further exacerbated by the invasion of Ukraine, which has caused the prices of agricultural commodities, oil and gas, and other commodities such as nickel to rise sharply. The US Consumer Price Index (‘CPI’) is now running at 7.9% year-on-year2, with inflation shooting up over the rest of the world as well.
Where does this leave credit? The response of central banks has been to signal a rapid end to tapering and a swift move towards rate hikes. The Bank of England has led the way, raising its base rate by 50 basis points to 0.75% in 2022, following a 0.25% hike in December 2021, with rates expected to reach 2.1% by December 2022. The Federal Reserve followed suit, raising its benchmark interest rate by 25 basis points to 0.50% in March, with forward curves implying that the market expects over eight rate hikes of 25 basis points each by February 2023 (Figure 1).
Figure 1. Market Implied Policy Rates
Problems loading this infographic? - Please click here
Source: Bloomberg; as of 28 March 2022.
The Growth Slowdown and the End of the Cycle
If central banks do raise rates, this will materially increase the likelihood of a recession. Recessions closely follow Fed hiking cycles, and are inextricably linked to the end of a credit cycle (Figure 2). Credit cycles are distinct from, but linked to, economic cycles and end when default rates rise and credit availability falls.
Recessions closely follow Fed hiking cycles, and are inextricably linked to the end of a credit cycle.
The primary way that Fed hiking cycles contribute to the end of a credit cycle is by bringing on a recession. Absent massive government interventions (as seen during the Covid-19 pandemic), recessions mean falling earnings, which in turn means that the weakest borrowers tend to default. The second way that a hiking cycle ends a credit cycle is by triggering loan covenants. Because interest rates rise, companies find it difficult to maintain their interest coverage ratios which are typically written into their covenants when issuing debt. This pushes firms into a technical default even if the firm continues trading, causing downgrades and selloffs within bond markets. As such, the Fed’s hiking path is not a positive development for credit markets generally, and high yield markets in particular.
Figure 2. Fed Funds Rate Versus NBER Recessions
Problems loading this infographic? - Please click here
Source: Bloomberg, National Bureau of Economic Research; as of 17 February 2022.
Animal Spirits Are Surging
Rapidly increasing leverage and overpayment for assets are both classic signs that a cycle is nearing its end.
Despite the rising likelihood of recession, animal spirits are surging. We saw record amounts of leveraged finance issuance by corporates in 2021 (Figure 3), which is helping to fund the number of M&A deals completed last year (Figure 4). Price multiples are near at least 28-year highs, with leveraged buyouts also near peaks, at just under 12x EBITDA (Figure 5). Rapidly increasing leverage and overpayment for assets are both classic signs that a cycle is nearing its end.
Figure 3. Leveraged Finance Issuance
Problems loading this infographic? - Please click here
Source: Bloomberg; as of 23 February 2022.
Figure 4. M&A Deal Count
Problems loading this infographic? - Please click here
Source: Bloomberg; as of 18 February 2022.
Figure 5. Leveraged Buyout – Trailing EBITDA Multiples
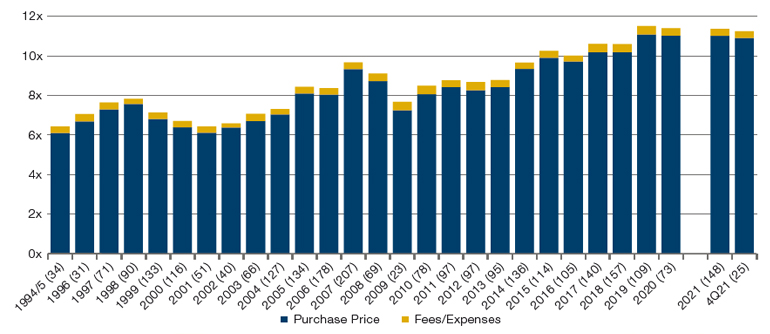
Source: S&P Global Market Intelligence; as of 31 December 2021.
But the scramble for leveraged finance issuance is only possible with a compliant investor base, ready to hoover up these new deals even with weaker deal terms. Covenants, typically found in the leveraged loan market, are the contractual restrictions that lenders require of borrowers. The trend has been for issuers to offer progressively weaker protection given increasing appetite for loans from both collateralised loan obligations (‘CLOs’) and institutional investors. Indeed, the issuance of covenant-lite loans has accelerated rapidly since 2008, and by the fourth quarter of 2021, accounted for more than 90% of new issuance (Figure 6).
Figure 6. Covenant-Lite Issuance
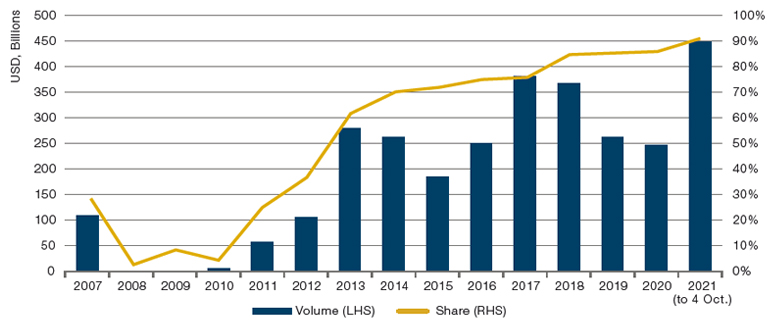
Source: S&P Global; as of 4 October 2021.
How to Cope
The Covid-19 pandemic has reduced the likelihood of a large numbers of defaults, without necessarily removing risk from the market.
It is therefore an ominous macro environment for credit, especially with record issuance (much of it underwritten at relatively lofty valuations, which provide little protection should growth start to falter or indeed turn negative). Where, then, can investors find opportunities in credit?
The first thing to note is that the Covid-19 pandemic has reduced the likelihood of a large numbers of defaults, without necessarily removing risk from the market: the sheer size of monetary and fiscal stimulus in 2020 means that many corporates have termed out their debt, borrowing as much as they are able with longer-term payment schedules at cheap rates. Even as rates rise, they should find it relatively easy to maintain coverage ratios – literally the ratio of the size of a repayment versus the assets a company has to pay them – as their coupon payments reflect older credit conditions rather than prevailing market rates.
This is demonstrated by the increased duration of US high yield debt, which has gone from a pre-pandemic low of 3.2 to 4.4 over the course of the last two years (Figure 7). Duration measures the sensitivity of a bond to interest rates, and is partly a factor of time to maturity – as time to maturity increases, so does rate sensitivity. With an increase in duration, we enter a paradoxical situation. The value of US high yield will fall if rates rise, but at the same time, as they rise, this creates an asset for borrowers, who have borrowed at below-market rates. Thus, we can have a riskier credit market even as default risk drops.
Figure 7. US High Yield – Effective Duration
Problems loading this infographic? - Please click here
Source: Bloomberg; as of 18 February 2022.
Figure 8. Median High Yield Coverage Ratio
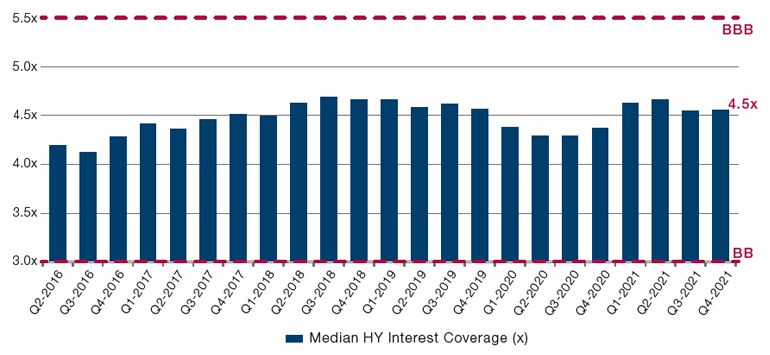
Source: Credit Suisse, Factset; as of 31 December 2021.
Sectors with the ability to push through price increases to the end consumer may be attractive, including consumer staples, health care and telecommunictions.
The second thing to note is that consumer leverage is not particularly high, with household debt service ratios at 5.41 in the third quarter of 2021, down from 5.66 in the same quarter in 2017.3 But if the asset side of consumer balance sheets does decline, we may see a drop in overall demand. Again, this does not mean that inflation will necessarily come down: as we said above, much of this inflation has been created by constricted supply rather than excessive demand.
Within this framework, opportunities remain. Sectors with the ability to push through price increases to the end consumer may be attractive, including consumer staples, health care and telecommunications. Additionally, we believe that investors should remain cautious towards the lower quality spectrum of the market, particularly in the US, where spreads are not compensating investors for a potential slowdown in economic growth. Indeed, history shows that when the option-adjusted spread falls below 700, 3-year excess returns become negative for credit rated CCC or lower (Figure 9). The option adjusted spread for CCCs is now 803 bps.4
Figure 9. 3-Year Excess Returns for US CCC and Lower
Problems loading this infographic? - Please click here
Source: Bloomberg, Man GLG; between February 2006 and January 2022
Conclusion
Industrials and other cyclical firms geared to the performance of the wider economy may struggle if the cycle ends.
But in a risky market, it is worth considering which credits are likely to underperform. In contrast to staples, as incomes shrink in real terms, consumer discretionary credits may be among the first to suffer. Likewise, industrials and other cyclical firms geared to the performance of the wider economy may struggle if the cycle ends. If investors wish to maintain returns throughout a possibly choppy cycle, it is imperative that credit managers are able to go short, in our view.
In our view, we may be approaching the end of both an economic and a credit cycle. All the classic signs of late-cycle euphoria are on display: accelerating inflation, central banks itching to raise rates, a rash of dealmaking, over-payment for assets and a glut of issuance on unfavourable terms for creditors.
While this may bode poorly for high yield returns at an index level, every downturn provides opportunity. In our view, investors should look to firms with pricing power to safeguard against inflation, while avoiding or shorting those firms most geared to the economic cycle.
1. As per the National Bureau of Economic Research methodology. In this instance, the cycle is measured from peak to peak. Other methodologies, including trough to trough, are available at: www.nber.org/research/data/us-business-cycle-expansions-and-contractions.
2. As of February 2022.
3. Federal Reserve: Household Debt Service and Financial Obligations Ratios (federalreserve.gov)
4. Source: ICE BofAML
You are now leaving Man Group’s website
You are leaving Man Group’s website and entering a third-party website that is not controlled, maintained, or monitored by Man Group. Man Group is not responsible for the content or availability of the third-party website. By leaving Man Group’s website, you will be subject to the third-party website’s terms, policies and/or notices, including those related to privacy and security, as applicable.