Introduction
In March 2017, we published a paper entitled Fire & Ice, which documented our view that the stock-bond correlation was dependent on the level and direction of inflation. The key chart summarising these views is shown in Figure 1.
Fire and Ice
To re-cap briefly, our assertion was that in Deflation, output prices fall but because the money illusion prevents companies cutting wages in nominal terms, costs rise in real terms, margins are hit, profits collapse and stock prices consequently fall. Conversely, fixed nominal coupons on bonds become more valuable in real terms and bond prices rise. Stocks go down, bonds go up, the stock-bond correlation is negative.
Then when policies are enacted to stimulate growth (think FDR’s New Deal, Bernanke’s helicopters and Draghi’s “whatever it takes”) the regime changes to Reflation. Inflation / pricing expectations rise, profits rise, stocks go up. Bond prices should fall as a little inflation nibbles away at future fixed coupon returns. The stock-bond correlation is still negative.
If reflation attempts succeed and nothing is done to rein in loose money, we then move into an Inflation regime (the 1970s, Germany and the US in the 1920s). This is basically terrible for all nominal assets. The present value of bond coupons falls as inflation eats away future values, yields rise, pushing up the discount rate for cash flows to equity, pushing equity prices down. Stocks and bonds fall together, the stock-bond correlation is now positive.
Eventually the authorities act to rein in inflation (Paul Volcker pushing up Fed funds to 20% in 1980), and it starts to decelerate. We have entered a Disinflation regime. It’s the opposite of inflation and Nirvana for asset prices. Stocks and bonds rally together. The stock-bond correlation is still positive.
Figure 1. Fire and Ice – Our Framework for the Stock/ Bond Correlation
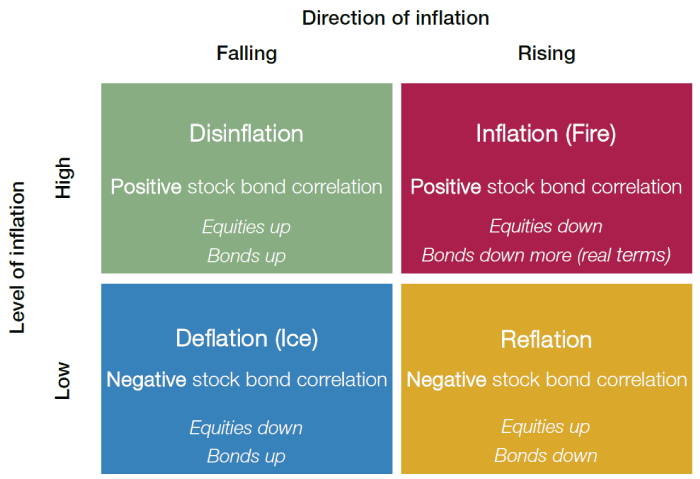
Source: Man GLG; as of March 2018.
In the paper, we presented data from the Bank of England showing the stock-bond correlation over 250 years (since 1764), as can be seen in Figure 2.
We noted that the recent 20-year period was anomalous, being the first time in this history that stocks and bonds had been negatively correlated over a 10-year period. However, we were not able to demonstrate conclusive empirical support from the BoE’s dataset for the predictions we made regarding equity and bond returns in each of the four regimes set out in our Fire and Ice framework. This was mainly because we were using annual time-series which did not give enough granularity for meaningful research.
We have now conducted a detailed time-series study that we believe does stand up, using the database published by Nobel laureate Robert Shiller. Professor Shiller’s data is monthly periodicity, meaning it is sufficiently granular to be meaningful, and includes series for stocks, bonds and inflation in the United States since 1872.
The criteria we set to determine which of our Fire and Ice regimes each episode fell into were these:
- Inflation (Fire): periods starting with moderate inflation and ending in substantially positive inflation;
- Disinflation: the reverse of the above;
- Deflation (Ice): periods starting with positive year-on-year inflation and ending in substantially negative year-on-year inflation;
- Reflation: the reverse of the above.
Figure 2. UK Stock/ Bond Correlation (1764 to 2017)
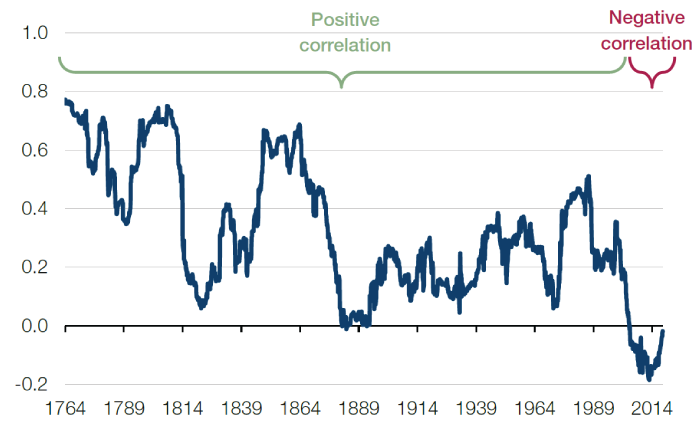
Source: Man GLG, Thomas and Dimsdale (2016) and Bank of England; as of 31 December 2018. Line shows ten year trailing correlation of monthly returns on UK equities and consols. See Matt Roberts-Sklar in Bank Underground: https://bankunderground.co.uk/2016/10/20/bitesize-250-years-of-the-bond-equity-correlation/
Asset Performance Under Fire and Ice
The summary results of this analysis are set out below:
The most important observation from this research is that the original thesis holds, with one small exception. Thus, as asserted in our original note:
- Equities do well in Disinflation and Reflation (positive real returns) but do poorly in Inflation and Deflation (negative real returns);
- Bonds do best in Deflation, well in Disinflation, poorly in Reflation and terribly in Inflation;
- Therefore, as asserted, the stock bond correlation is broadly positive in high inflation regimes (Inflation, Disinflation) and negative in low inflation regimes (Deflation, Reflation).
There is, however, one assertion from the original thesis that is not supported by the analysis. In the Inflation regime, we said that “equities go down, but bonds go down more (in real terms)”. Empirically this is only half true – both equities and bonds go down in real terms, but equities fare worse than bonds not the other way round. Oh well. The point still stands that neither of the traditional risk premia does well in an inflationary world.
Figure 3. Asset Class Performance in Four Regimes – Real, Annualised Return (median), (1872 to 2018)
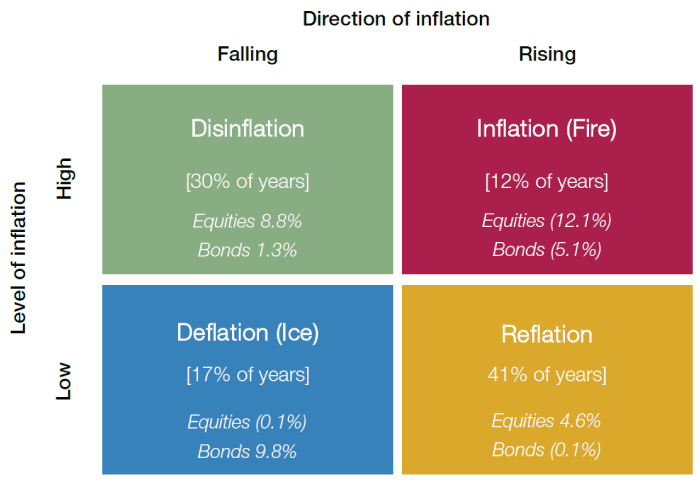
Source: Man GLG, Robert Shiller (Yale University); as of 3 April 2018.
One final point of empirical support for our framework is shown in Figure 4, again drawing on the Shiller database. The cyclically-adjusted price-to-earnings ratio is, on average, highest when inflation ranges between 0-4%. On average, it then falls away pretty sharply as inflation accelerates toward a 10% annual rate, and but also falls away as inflation decelerates into negative territory towards -10% annual rate. In other words, our intuition that high inflation and outright deflation are bad for stocks clearly holds up in the data.
Figure 4. Shiller CAPE in Different Inflation Regimes (1872 to 2018)
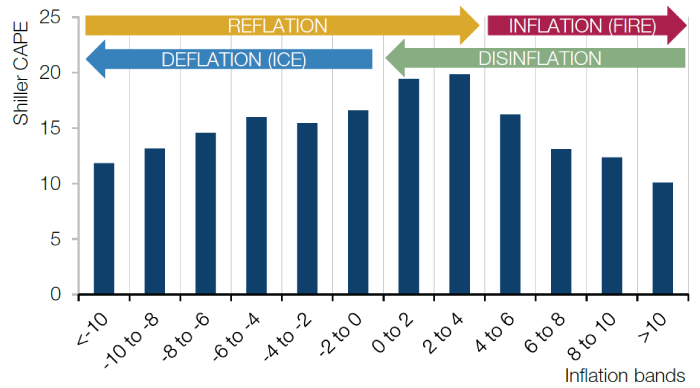
Source: Man GLG, Robert Shiller (Yale University); as of April 2018.
Conclusion
To our mind, this all points to the inflation risk embedded in most traditional multi-asset funds, be they 60/40 (equity/bond), risk parity, target return or similar. Money has flooded into these funds over the last decade as they have benefited from an environment that has swung between Disinflation (with fears of Deflation) and Reflation but where in aggregate, because of quantitative easing, all asset prices went up more than they went down! In our view this implies that uncorrelated assets have never been so necessary.

You are now leaving Man Group’s website
You are leaving Man Group’s website and entering a third-party website that is not controlled, maintained, or monitored by Man Group. Man Group is not responsible for the content or availability of the third-party website. By leaving Man Group’s website, you will be subject to the third-party website’s terms, policies and/or notices, including those related to privacy and security, as applicable.