Introduction
Markets have climbed a large wall of worry in 2019. Is there any wall left to climb in 2020?
Earlier in 2019, there were many things to worry about, including:
- By the end of the first quarter, out of the G7, only the US and UK manufacturing PMIs had not fallen below 50, into contractionary territory;
- The US yield curve had inverted, a traditional harbinger of a US recession;
- The repo market in the US was in distress in September, potentially flagging the Federal Reserve losing control;
- The China-US trade war was intense, and could escalate to such an extent that ever-rising tariffs would cripple global supply chains and the global economy;
- The UK political situation and parliamentary numbers were such that a hard Brexit seemed a plausible outcome;
- The US Democratic Presidential candidate could well be a populist candidate, with a policy agenda that would hurt financial markets.
These, and other concerns, formed a beautiful large wall of worry that markets have climbed ferociously in 2019. Indeed, these worries were so prominent that indicators of valuation and sentiment reached very low levels, and policymakers were compelled to act dovishly and add stimulus through rate cuts or balance sheet expansion.
The Crumbling Wall
This wall of worry has started to crumble of late as many of these fears are easing: PMIs have stopped falling and started climbing the last few months; the US yield curve is not inverted anymore; the Fed intervened heavily and calmed the repo market; the trade war has reached some kind of truce, however temporary; the UK election has resulted in a move away from the gridlock of the last few years; and currently the US Democratic Presidential candidate seems most likely to be more market-friendly than some feared a while back.
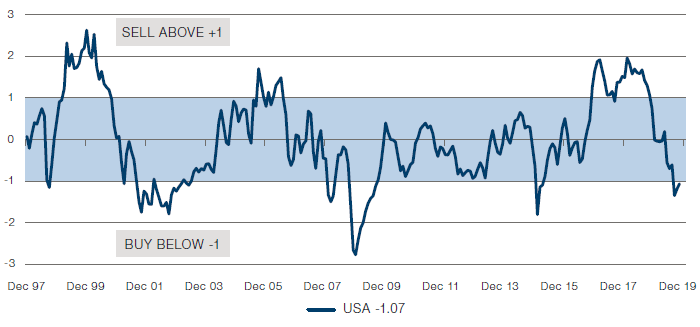
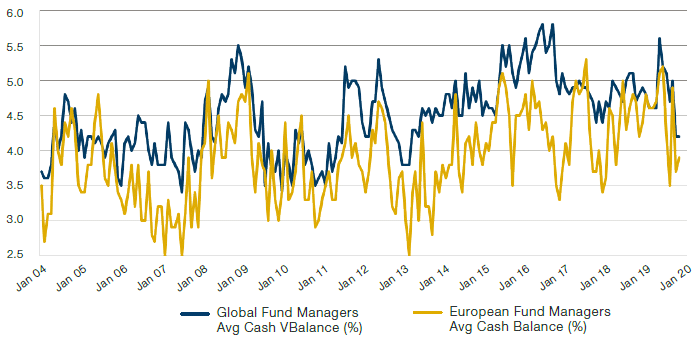
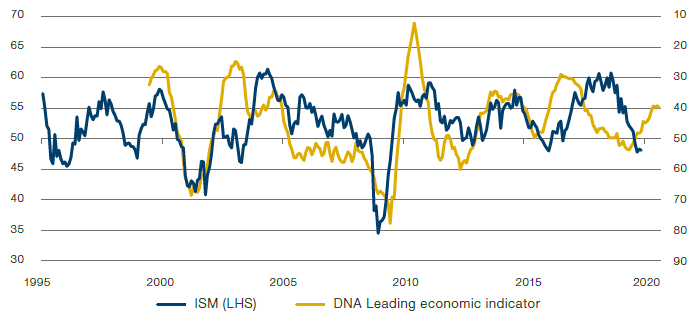
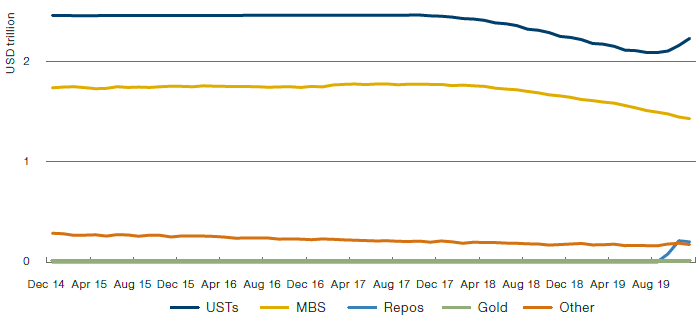
However, we do not believe it is time to take money off the table. While our indicators of valuation and sentiment have risen, they are still reading ‘buy’ or ‘neutral’ in US and Europe (Figures 1, 2). Equally, the nascent recovery in lead indicators such as the US ISM has much further to go, according to our lead economic indicator (Figure 3). And finally, policymakers around the world have made it clear that they are in no hurry to turn hawkish again, quite the contrary (Figure 4). At the same time, the political will for some fiscal spending is rising around the world. Better growth, dovish policy, no sell signals: this is a positive backdrop for equities and credit alike.
Figure 1. US Composite Value Indicators
Source: Man DNA team, MSCI, Morgan Stanley, Bloomberg; as of 18 December 2019.
Figure 2. BAML Fund Manager Survey – European and Global Cash Levels
Source: BofA European Fund Manager Survey; as of 18 December 2019.
Figure 3. US Non-Manufacturing ISM Forecast Model
Source: Man DNA team, inspired by work done by Cornerstone Macro, ISM, Bloomberg; as of 18 December 2019.
Figure 4. Fed Balance Sheet
Source: Federal Reserve, Bloomberg; of 18 December 2019.
One tail risk is that the rising political will for fiscal spending could lead to higher inflation. Take Europe, for instance. The new UK government is stepping up its spending plans worth around 1% of GDP; Christine Lagarde continues to suggest that fiscal policy should help monetary policy in Europe, and additional fiscal is worth around 0.3% of GDP already; even Jens Weidman was quoted as saying that excessive fiscal prudence in Germany has served its purpose.1 Japan has announced renewed fiscal spending worth around 2% of GDP. In the US, too, the next president could be in favour of big spending plans. Our best guess, however, continues to be that fiscal policies will only change in a more meaningful way in response to an economic crisis when unemployment rises. We do not exclude the possibility that fiscal spending will rise in reaction to a self-declared climate change crisis, without such a rise in unemployment. So we continue to monitor the critical inflation outlook closely, but for now, there is nothing dramatic to see.
Our Fire & Ice framework governs our thinking. We judge that the global economy is still in ‘reflation’, but we are monitoring the situation very closely. It is possible, even likely, that the next investment regime is ‘inflation’, driven by fiscal spending. This is a very dangerous regime indeed, during which traditional assets are likely to fall, and the diversification benefits of holding equities and bonds are likely to disappear, in our view.
So, what is our view on how investors should be positioning themselves at the present juncture?
Firstly, we would be overweight equities. Regionally, we have a positive view on the UK, along with Japan. The UK equity market has suffered from the political uncertainty to such an extent that an attractive entry point is provided for global investors. The decisive victory of the Conservatives should solve the political gridlock, and the chances of the undervaluation starting to lead to significant outperformance have increased. There are still risks of course, including the uncertainty around the trade negotiations and the future relationship with the EU post 31 December, 2020. We would, however, be underweight Europe and the US.
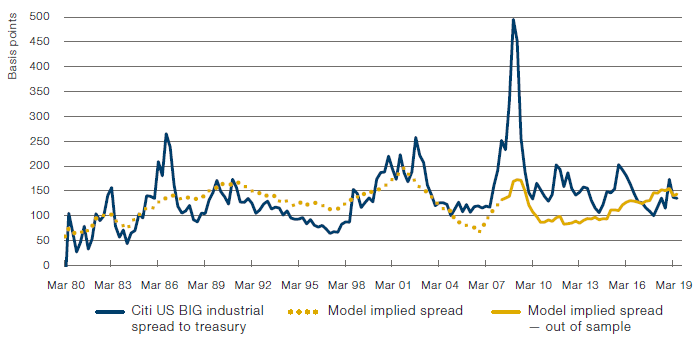
We would also be underweight on fixed income: bonds are still expensive, and growth is set to improve further. In addition, we would be underweight duration. Despite historically narrow spreads, we believe the fundamental outlook of decent growth without overheating will continue to be supportive of carry (Figure 5).
Figure 5. US IG implied spreads model
Source: Man DNA team, Citi, Moody’s, Federal Reserve, Bloomberg; as of 18 December 2019.
What Could Go Wrong? Risks to Our Positive View
First and foremost, and as per our Fire & Ice framework, we monitor the risk of the return of inflation, as it could have potentially disastrous consequences for traditional asset classes; we believe a very different asset allocation may be appropriate in this circumstance, as already discussed.
More specifically, we see three main risks ahead:
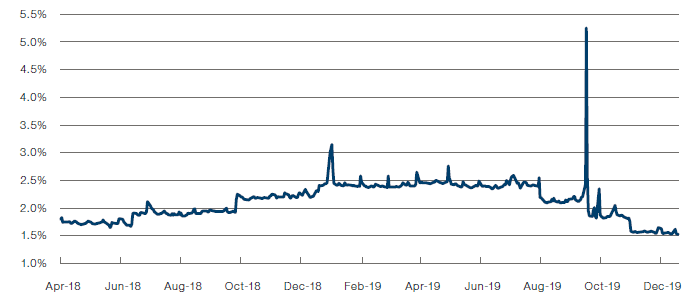
- Tightening in US dollar liquidity: In late September, the corridor system constraining effective Fed funds to a 25-basis points range between the upper and lower bound was broken. Fed funds swapped hands at 3.00% briefly on 17-18 September, when the channel was 2.00-2.25%, and the secured overnight financing rate spiked to 5.25%. Some people started to worry that the Fed had lost control. Our own view was and remains more benign, being that as long as the Fed is willing to use repo operations to inject liquidity and to add reserves into the depository system, it can retain control of bank funding costs. What are we watching?
a. FRA-OIS widening out – indicating a rising cost of term funding for banks;
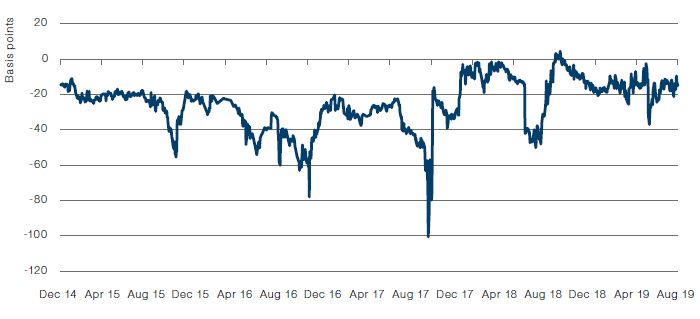
b. Dollar basis swap spreads rising, indicating dollar funding costs are rising (Figure 6);
c. Effective Fed funds breaks out of the corridor – indicating the Fed is ‘losing control’ (Figure 7).
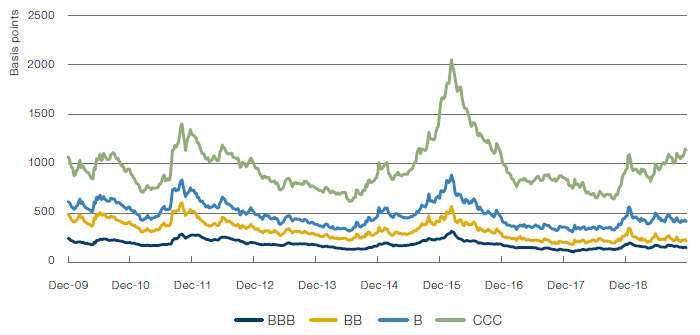
- Credit cycle deteriorating: There has been notable underperformance by the lower end of the junk bond market, with CCC rated US corporate total return indices losing 7% since the end of April, while higher quality credits in the BBB to BB and B ratings have continued to make +5% to +7% returns. CCC yields have backed up 275bp from 8.6% to 11.4%, and are now half way back to the wides recorded during the oil shock in late 2015 (Figure 8). While that episode was largely confined to the oil sector as the oil price halved, this time spreads are widening out as oil is going up. What are we watching?
a. Benchmark composition deteriorating;
b. CCC underperforming BBB;
c. Credit card delinquencies / other loans seasoning poorly.
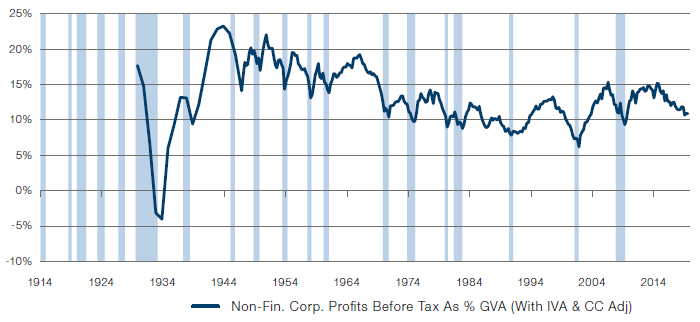
- US recession: Our cycle tracker keeps an eye on six factors: inflation, profit margins, Fed funds, yield curve, credit spreads and weekly claims. Of these, we are watching credit spreads closely. Corporate profit margins are also becoming a concern, having fallen to levels at which in the past corporates have tended to take action either deferring capital spending or laying off workers (Figure 9). What are we watching? In addition to the above, we are also keeping an eye on:
a. Fed tightening – raise rates, shrinks excess reserve balances;
b. Yield curve re-inverting;
c. PMIs falling (or remaining) below 50.
To these three main risks, we can add a litany of smaller risks – which, if they worsened, would have the potential to cause markets to correct. Among them we’d list: a deteriorating political economy and the rise of Socialism; any hint that Elizabeth Warren could win the Democratic nomination; the trade war reigniting or mutating into a US-Eurozone trade war; the Chinese cyclical recovery failing to gain traction, or it gaining too much traction and allowing the Chinese authorities to re-tighten.
Figure 6. EURUSD Basis Swap
Source: Bloomberg; as of 18 December 2019.
Figure 7. US Secured Overnight Financing Rate
Source: Bloomberg; as of 18 December 2019.
Figure 8. US Corporate Bonds Libor OAS Spread
Source: Bloomberg; as of 18 December 2019.
Figure 9. US Margins
Source: Bloomberg; as of 18 December 2019.
You are now leaving Man Group’s website
You are leaving Man Group’s website and entering a third-party website that is not controlled, maintained, or monitored by Man Group. Man Group is not responsible for the content or availability of the third-party website. By leaving Man Group’s website, you will be subject to the third-party website’s terms, policies and/or notices, including those related to privacy and security, as applicable.