Cyclical stocks are considered a strong reflection of the current state of the US economy, given the sector’s historical correlations with activity metrics like the ISM Manufacturing Index (or Purchasing Managers’ Index). The ISM measures the demand for products through order volumes and is a key US economic indicator.
However, in 2024 so far, cyclical stocks have bucked the historical trend by generating positive returns when the ISM is contracting. Year-to-date, the performance of cyclicals has deviated significantly from what we might have expected, returning over 7.3% from the start of the year until 27 June. Meanwhile, the ISM has been at or below 50, i.e. in contractionary territory, for the last one-and-a-half years. We’ve never been at these levels before without being in recession, a fact which has given us pause for thought.
Problems loading this infographic? - Please click here
In the week ending on 24 June, cyclicals switched course. The sector underperformed defensive stocks (securities which have historically been more resilient to the evolving business cycle) by 2.5%, or 1.8 standard deviations. This happened even as energy, a sector which is extremely sensitive to cyclical demand, rallied over 4% on the strength of a move higher in oil prices.
Is this a market shiver or the beginning of a more sustained change in direction? It’s too early to say. One thing is certain: although remembering past relationships can be painful, it may just be the key to avoiding future troubles. This is one dynamic we'll be watching closely.
Weathering Election Market Uncertainty
Unsurprisingly, election risk was one of the largest concerns we identified when we set our predictions for 2024 earlier this year (broader geopolitics, climate events, the re-emergence of inflation and hedge fund degrossing were others). With election outcomes notoriously difficult to predict – as we’ve seen in India, Mexico and South Africa – how can investors manage the risks to their portfolios?
Let’s start with volatility
Volatility indices offer useful barometers of the level of risk associated with an election, without the need to determine the impact and likelihood of each potential outcome.
Strikingly, developed market (DM) volatility briefly spiked above emerging market (EM) volatility at the end of June on developments in European politics, namely the outcome of the European Parliament elections and French President Emmanuel Macron’s unexpected call for a snap election.
Figure 2. DM markets spooked by European politics
DM versus EM implied vol spread (1-month)
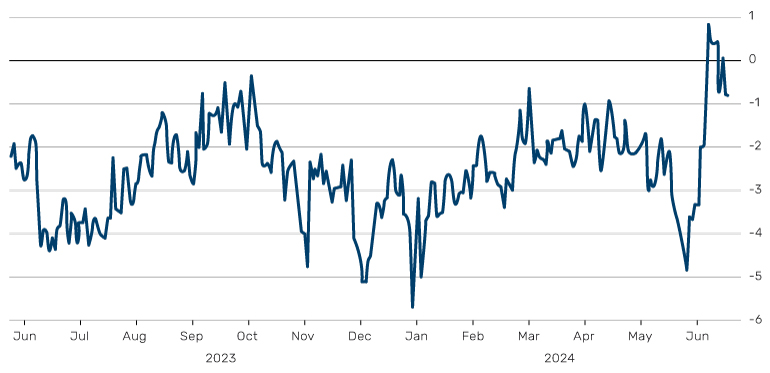
Source: Bloomberg, as at 25 June 2024.
Further, although France’s CAC 40 has partially recovered from the initial shock selloff following the announcement and gained further on Monday on the news that the far right might not secure an outright majority despite winning the first round of the French elections, implied volatility from options on the equity index remains elevated. This suggests that the market continues to be concerned about the final outcome of the election and its potential implications.
Figure 3. French short-term volatility spiked on run up to election
CAC 40 Index 30-day implied volatility
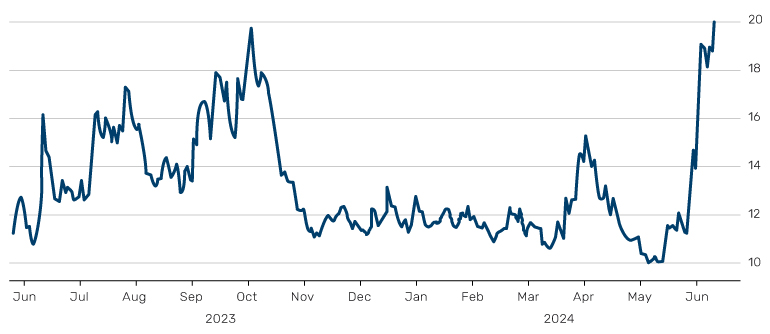
Source: Bloomberg, as at June 2024.
Taking it further
Aside from looking at volatility, managers can take a forward-looking approach by identifying key components of the various potential outcomes and constructing stress scenarios to forecast their impact on portfolios.
An absolute majority for the right-wing Rassemblement National in the French elections, for example, increases the likelihood of ambitious spending proposals being passed, such as lowering the retirement age; as well as an increase to France’s already stretched budget deficit. This would likely have a further knock-on impact on French debt which has suffered since the snap election was called and saw a rating downgrade from S&P, though like the equity index, recovered slightly on Monday in response to the results of the first round of the election.
Expect the unexpected
With that said, it is important to avoid overloading a stress scenario with too many predictions. Even with perfect foresight of the outcome of an election, the direct market impact can be notoriously hard to call. Take, for example, Donald Trump’s victory in the 2016 US Presidential Election when the immediate market reaction during Asia trading hours was swiftly reversed when US markets opened the following day.
Instead, multiple scenarios should be deployed across a range of potential outcomes to identify potential weaknesses in a portfolio, irrespective of whether the outcome aligns with the perceived ‘most likely’ result.
Designing elections stress tests
When it comes to designing election stress tests, both historical and hypothetical (whereby we prescribe market moves) scenarios can be useful. In the case of the latter, how does the current market environment compare to the backdrop in the run up to previous elections?
For hypothetical scenarios, beware of hidden correlation assumptions! It is common to apply scenario shocks to a subset of markets within a portfolio – typically those directly impacted by the election result – leaving the moves in the remaining markets to be determined by recent correlations. This can be problematic if the typical relationship between asset classes and geographies shifts suddenly.
For example, we usually see a strong positive correlation between French and German government bonds. However, this faltered after the snap election was called, as the spread between the two widened to the highest levels seen since the uncertainty which preceded the French presidential election in 2017.
Prepare, don’t predict
To shore up portfolios against election risk, we aim to avoid an outsized reaction through rigorous stress testing, rather than seeking to maximise returns based on forecasts about an outcome.
With contributions from Henry Neville, Portfolio Manager at Solutions, and Oliver Whitehead, Head of Investment Risk at Man AHL.
You are now leaving Man Group’s website
You are leaving Man Group’s website and entering a third-party website that is not controlled, maintained, or monitored by Man Group. Man Group is not responsible for the content or availability of the third-party website. By leaving Man Group’s website, you will be subject to the third-party website’s terms, policies and/or notices, including those related to privacy and security, as applicable.