Much has been written about the ‘magnificent seven’ holding up stock market indices, low market breadth and high levels on the Nasdaq and S&P 500 indices. These would ordinarily indicate a bubble, but what do valuations tell us about the health of the equity market?
Earnings are the all-important denominator in this valuation metric, and we are currently deep in reporting season – will earnings continue to hold up and provide support for valuation multiples?
Reporting season kicked off well last week when Netflix beat analyst expectations for third-quarter revenue and said profit margins will improve to at least 22% next year and have the potential to grow further in the years ahead.1 Mega-cap stocks Alphabet, Amazon, Meta and Microsoft will report this week.
Looking back over previous bubble peaks, forward price/earnings (P/E) of the top 10 largest stocks by market capitalisation were far higher in 2000 and even at the Covid peak. None of today’s top 10 comes anywhere near Oracle’s lofty valuation of a forward P/E of 131 back in 2000.
Figure 1. Current valuations are not anywhere near bubble territory
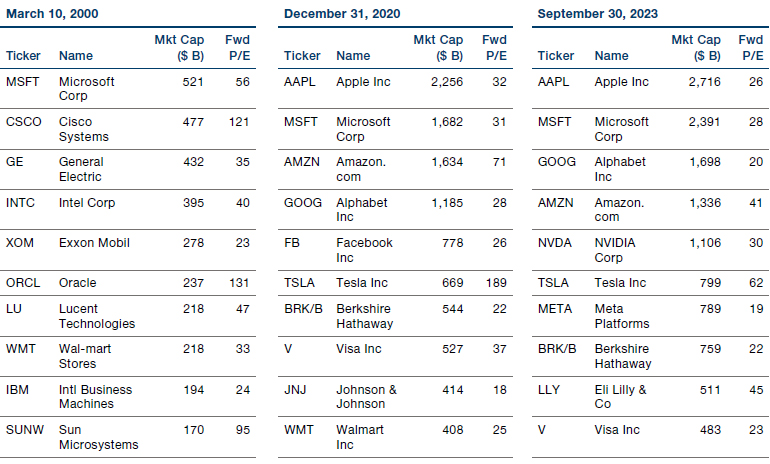
Source: Bloomberg/Numeric.
To put the above comparison into context, the S&P500 forward P/E in March 2000 during the height of the technology sector bubble was 24.65, at the end of 2020 it was 27.86 and 19.40 at the end of the third quarter of this year, according to Bloomberg data — which is really not far from historical averages.
Forward P/Es are of course only one measure of assessing the state of equity markets. Our previous work using factor models2 shows how the tone of today’s market environment is quite unlike the 2001 technology bubble.
Factors that our supervised models are showing as dominant in today’s markets suggest that the mood is still tilting towards the risk-on, as leverage features amongst the strongest positive numbers while dividend and earnings yields are amongst the lowest. Profitability measures are still important, while growth factor is now neutral to slightly negative, which suggests that, unlike previous peaks that proved to be based on hype, the market continues to investigate the fundamentals rather than simply focusing on a narrative around technology-heavy mega caps and the potential benefits of AI.
Figure 2. Still tilting towards risk-on environment for now
Problems loading this infographic? - Please click here
Source: Man Numeric.
Bond and equity markets continue to disagree over where investors should put their money though. The sharp rise in 10-year Treasury yields to around 5% this year means they are now triple the S&P 500 yield. The Fed Model compares the expected earnings of the S&P 500 index to the yield on 10-year Treasury bonds.
The historical average of the Fed model is 4.01%. Currently, at the end of Q3 2023, it has narrowed to 0.71%, which is close to the lowest levels ever observed in the past (except during the Technology bubble in the late 90s when it briefly went negative).
Figure 3. The Fed Model has sunk close to the lowest since the tech bubble
Problems loading this infographic? - Please click here
Source: Bloomberg.
History shows us that such a wide gap between the two does not last forever. Earnings now really need to deliver to keep equity animal spirits engaged. If they don’t, equity prices and bond prices have to start converging to bring the Fed Model closer towards its long-term average.
With contributions from Eric Wu, Principal, Quantitative Alpha Integration and Strategy, Valerie Xiang, Associate Portfolio Manager, Scott Skirlo Associate Quantitative Researcher, Numeric Investment Management.
1. https://www.bloomberg.com/news/articles/2023-10-18/netflix-will-raise-prices-after-best-subscriber-growth-in-years
2. https://www.man.com/maninstitute/views-from-the-floor-2023-july-04
You are now leaving Man Group’s website
You are leaving Man Group’s website and entering a third-party website that is not controlled, maintained, or monitored by Man Group. Man Group is not responsible for the content or availability of the third-party website. By leaving Man Group’s website, you will be subject to the third-party website’s terms, policies and/or notices, including those related to privacy and security, as applicable.