Macro History Explains Bullish Market Tone
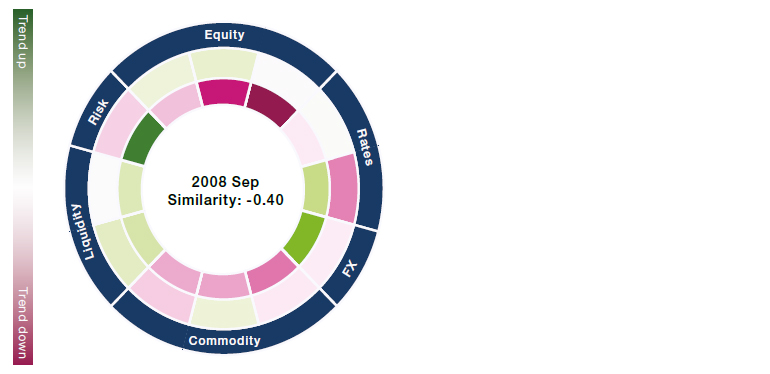
With the debt-ceiling debacle abating and insolvency risk in the banking sector getting some temporary relief, the market has ended the second quarter on a bullish tone. Though the market’s resilience has confused many investors, the current environment does have some similarities with historical periods, as suggested by MacroScope, our macro regime modelling framework that examines historical patterns in the macro environment to build a diverse view of the macro regime similarity and to forecast forward industry and style factor returns. This quarter, its similarity measures suggest the current backdrop is the opposite environment to September 2008, which marked the depths of the Global Financial Crisis and was the month that Lehman Brothers collapsed. With the performance of almost all assets then being characteristically different from what we are now experiencing, September 2008 has a low similarity score of -0.4 with today. The largest distinction is in market volatility, which spiked in 2008 but has stabilised recently. Following September 2008, anti-risk sentiment continued to dominate the market, leading to an outsized drawdown in market beta factor. This is depicted in Figure 1, where the outer circle represents price trends of various assets during the current period, with the inner circle representing September 2008.
Figure 1. MacroScope flags September 2008 as an opposite regime to the current market; Forward 1-month factor returns, %
Problems loading this infographic? - Please click here
Source: Numeric, MSCI Barra, data as at 31 May 2023.
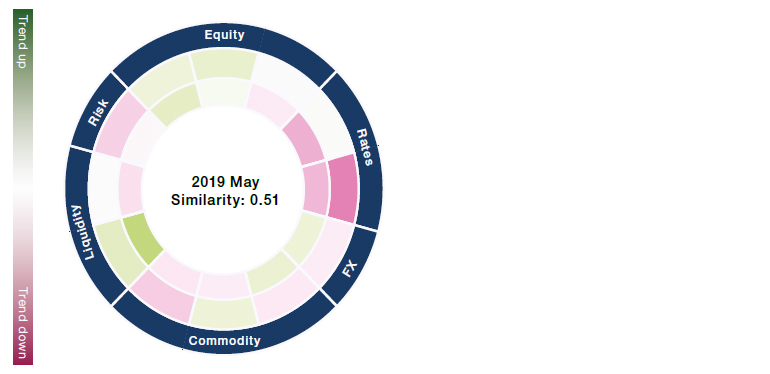
When it comes to the most similar historical period, May 2019 seems to be the closest match. Here, the fixed income market was the largest contributor to the high similarity score as the short end of the interest rate curve trended upwards relative to the long end, just like today. Interestingly, while an inverted interest curve typically indicates looming recession risks, risky assets like equities remained resilient during the May 2019 period, represented in Figure 2 by the inner circle, similar to today’s markets.
Figure 2. May 2019 stands out as one of the most similar historical periods; Forward 1-month factor returns, %
Problems loading this infographic? - Please click here
Source: Numeric, MSCI Barra, data as at 31 May 2023.
Those similarity scores have jointly led to a bullish view of the current market, which can be seen in the model’s positioning on various style factors as shown in Figure 3, such as favouring beta and residual volatility but disliking quality measures such as profitability and investment quality. While a soft landing is not yet market consensus, it does seem to be consistent with how the market has been pricing things in the past several months, which makes intuitive sense as MacroScope relies on market tradable instruments to represent macro regimes.
Figure 3. Risk Assets Getting a Bid: Latest MacroScope Factor Positioning
Problems loading this infographic? - Please click here
Source: Numeric, MSCI Barra, as at 29 June 2023.
Don’t Write Off the UK Consumer Just Yet
Anyone looking for a place of weakness in 2023 would surely have placed their bets on the UK consumer as likely to face a number of challenges. Yet recent trading updates from many UK retailers have shown surprisingly strong growth numbers. What’s going on? While it’s true that 2023 has been a year featuring mortgage rates rising and some sharp increases in the price of food, the average UK household is actually feeling richer in the short term thanks to recent strong wage rises, and this appears to be translating into spending on consumption. Figure 4 shows that while non-discretionary spending on mortgages, food and energy have all been more negative for household cashflow than the previous year, the average impact of these expenses is less than the positive effect of recent pay rises.
Figure 4. UK consumer resilience
Problems loading this infographic? - Please click here
Source: Lazarus Economics, April 2023.
Some of the cashflow-negative items are also not necessarily being felt by all consumers in the UK. Mortgage rate increases, for example, are receiving a lot of attention in the media, yet more than a third of houses are owned outright, so that figure of £901 extra spend would create no cashflow impact for houseowners that are mortgage-free. The energy price cap is now being lowered, so customers could soon be paying less for their gas and electricity. Finally, food price inflation also looks to have turned recently. The negative cashflow items have therefore been getting better recently, leading to the UK consumer’s cashflow being more positive, at least in the short term.
Last but not least, interest rate rises do have the benefit of raising the amount savers earn on their interest, which is also having very real effects on cashflow for a significant number of households. In the near term at least, the average household appears to be feeling more flush, and is spending their cash. Some UK retailers have been the beneficiaries of this spending, with a number of high street names having put out surprisingly strong trading updates in recent days. So despite the negative headlines, it seems that the UK consumer should not to be written off just yet.
With contributions from: Valerie Xiang (Associate Portfolio Manager, Man Numeric) and Jack Barrat (Portfolio Manager, Man GLG).
You are now leaving Man Group’s website
You are leaving Man Group’s website and entering a third-party website that is not controlled, maintained, or monitored by Man Group. Man Group is not responsible for the content or availability of the third-party website. By leaving Man Group’s website, you will be subject to the third-party website’s terms, policies and/or notices, including those related to privacy and security, as applicable.