In light of the ‘higher-for-longer’ narrative that has been interwoven in the remarks of Federal Reserve (Fed) officials in recent weeks, and the subsequent spike in volatility across asset classes as bonds and equities have sold off, how does the market’s view of rates compare to the Fed’s? The famous dot plots below are the starting point to explore this.
Figure 1 shows the Federal Open Market Committee (FOMC) ‘dot plot’, the Fed's visual representation of the FOMC members' views of how interest rates will evolve in the future. These quarterly forecasts correspond to the expected rate at a given year-end. These forecasts, as of September 2023, suggest that the FOMC believes that there will be a further 25bps hike in the final part of this year, followed by significant cuts in the years ahead in order to bring the Fed Funds rate to the longer-run target. As the longer-run dots show, this circa 2.5% level is what the Fed believes is, or is very close to, the r* - the ‘neutral’ interest rate that is commensurate with a US economy that has full employment and stable inflation.
Looking at the path to reaching r* in isolation, it is reasonable to interpret that a sustained period of tighter monetary policy is probable and indeed what the Fed itself believes will happen, as rates are expected to remain relatively stable through to 2024, with bulk of the rate cutting to reach r* forecast to occur beyond this. It is worth caveating at this point that the dots are merely a snapshot of a point in time, and the FOMC’s forecast may shift in either direction depending on the prevailing health of the US economy or an altered trajectory due to a change in the FOMC’s perception of r*.
Figure 1. FOMC ‘dot plot’
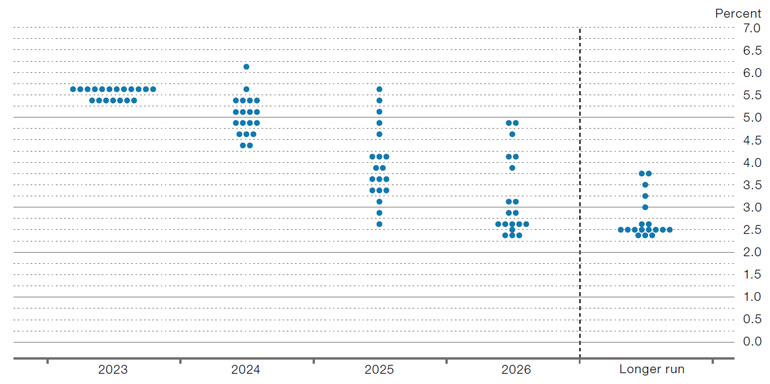
Source: Federal Reserve Summary of Economic Projections, as at 20 September 2023.
Available here: www.federalreserve.gov/monetarypolicy/files/fomcprojtabl20230920.pdf.
To see how the market is predicting interest rates, we can turn to Fed Funds futures. In Figure 2, we reproduce a chart from No More Horses! The Predictability of Returns and Risk, and Their Use in Asset Management, with data updated to September 2023, effectively comparing Fed Funds futures to the Fed Funds effective rate since 2000. This time, the key question we asked ourselves was how these forecasts compare to median estimates from the ‘dot plots’ from Figure 1 so we added these to the chart. At first glance, the market seems to believe that the Fed will hold for the rest of 2023, keeping rates unchanged, which as we’ve shown, Fed officials in aggregate do not seem to agree with. Beyond this, there seems to be agreement on the cuts out to 2025, with the slight deviation being the steeper gradient of cuts expected by the market. Interestingly, after 2025, there is broad divergence between the two, with the market expecting rates to land on a higher long-term or r* level, plateauing from 2025.
Figure 2. Effective Fed Funds rate versus market expectations
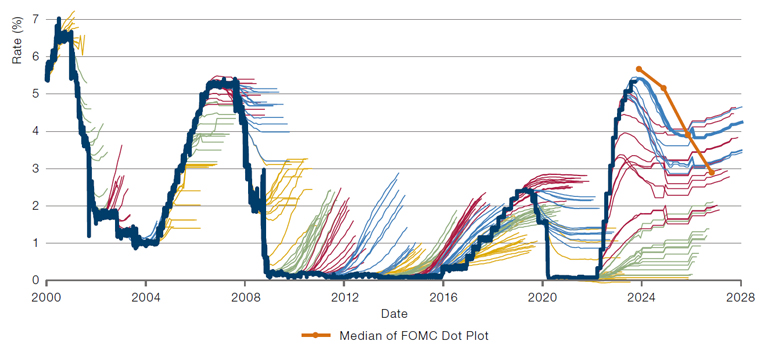
Source: Bloomberg, Man Group, as at September 2023.
How should we interpret this? In spite of questions over a hike in 2023, should we take comfort in the broad agreement of our two sources out to 2025, and forgive divergence beyond that? Chalking that longer-term deviation up to uncertainty over the far-ish future? We might take a more pessimistic view. Taken in its entirety, Figure 2 shows that there is little predictive power in futures markets about how interest rates will evolve, and hence agreement between Fed officials and the market should not give us too much solace. After all, to quote Niels Bohr, “Prediction is very difficult, especially if it’s about the future.”
With contributions from Yash Panjabi, Client Portfolio Management Analyst, and Graham Robertson, Partner and Head of Client Portfolio Management, at Man AHL.
You are now leaving Man Group’s website
You are leaving Man Group’s website and entering a third-party website that is not controlled, maintained, or monitored by Man Group. Man Group is not responsible for the content or availability of the third-party website. By leaving Man Group’s website, you will be subject to the third-party website’s terms, policies and/or notices, including those related to privacy and security, as applicable.