US Inflation: Out of the Frying Pan
Earlier in the year we presented our model for forecasting US headline CPI over the subsequent 12 months. At the time we noted that we were well above the market in terms of our expectations. Last month’s CPI printed at 7.5%, beating most estimates (including our own), and we thus felt it would be a useful time to update the model, which we reproduce below (Figure 1). The yellow dashed line is the pathway that was being forecast at the start of the year, while the current estimate is demarcated in dashed blue. The circles at the end of the chart show a range of forecasts made by others, either explicitly or implicitly based on derivative market pricing. Bottom line: we are still well up at the top end of the range.
Figure 1. US CPI and Forecasts
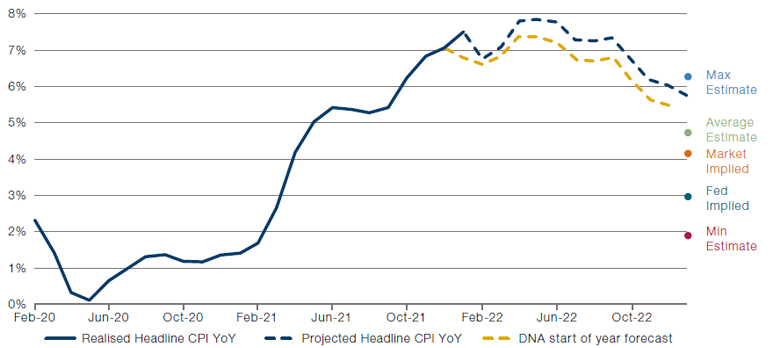
Source: Man Solutions, Bureau of Labor Statistics, Bloomberg; as of 15 February 2022. Future market and interest rate conditions, among other factors, may affect inflation, and are outside the control of the firm. These future events may materially affect results. Investment decisions should not be made based upon these projections.
The biggest driver in our model is Shelter, which we expect to start reflecting more fully the historic rise in house prices experienced over the last 12 months. We find this to be pretty well understood in the conversations we’re having. There are three themes that are less well understood, however, and for us are further evidence as to a less pronounced rollover than some are hoping for.
First, further contribution from commodity costs should not be discounted. The Energy component of the CPI basket rose 1.7% (NSA) in January, well over double its longterm seasonal average of 0.7%. For many there is an implicit assumption that oil can’t go much above USD100 per barrel, and indeed, with the tension in Ukraine seeming to dissipate somewhat, it is certainly not foolish to argue for some softness in the near term. But we would point out that, in real terms, just to return to the USD120 highs of 2012 would imply moving to USD170 in today’s prices. That’s not our base case, but we don’t discount it either.
Secondly, we are yet to see evidence of supply chain bottlenecks easing. Take the Apparel category for instance. This almost always falls in price in January, as retailers push discounts to sell down excess Christmas stock. In the 68 years we have data for, US Apparel prices have fallen in January in 62 of them. On average they fall a little over 1%. In 2022 they rose vertiginously, by 2.5% on the month. Chatter on earnings calls is that supply chain snarl ups are not abating, contrary to the popular narrative, and this could further fuel general inflation this year.
Finally, we are starting to see early signs of wage pressures heating up services segments of the CPI basket, which have been among the more muted categories for a while. Medical Services and Transport Services, for instance, have both been below their seasonal averages more often than not over the past six months, in contrast to the rest of the index. Both are now showing hints of reversing that trend. Notably, for all the headlines around nominal wage rises, most workers are still being short-changed in real time. If we look at the Atlanta Fed tracker, our favoured metric for the US, we see wages rising at 5% year-on-year. With inflation where it is, that amounts to a 2.5% pay cut. This story, in other words, could have much further to run.
Rate Hikes Won’t Be Enough – Repression is Here To Stay
We are currently enduring a sharp bout of financial repression, with interest rates well below inflation. With US CPI running at a 40-year high of 7.5%, real rates are at all-time lows (Figure 2). But this financial repression is here to stay – at least according to the markets.
The market-implied policy rate indicates that the Federal Reserve will implement around 6.4 rate hikes within a year, raising the policy rate to 1.8% (Figure 3). However, the market’s estimate of inflation over the next year is 4%.
If both estimates are correct, it would then take 8.8 additional rate hikes to bring the real rate back to zero. As we’ve previously discussed, our own inflation estimate is much higher, but as far as we are aware, no commentator has predicted 15.2 hikes. Unless we see a significant and surprising drop in inflation levels – such as US CPI around 2.2% - it is clear that real rates are almost certain to stay negative. Like it or not, deep financial repression is here to stay.
Figure 2. US Real Rates
Source: Bloomberg; as of 17 February 2022.
Figure 3. Market-Implied Policy Rates
Source: Bloomberg; as of 17 February 2022.
The Stock Picker’s Market?
Volatility is on the rise. Since the onset of the year, the VIX index (a measure of US equity volatility) has risen from 17 to 25, reaching a 12-month high of 31 along the way. However, this volatility is not simply a macro rotation, boosting some sectors and depressing others. We are also seeing significant intra-sector volatility, with widely differing returns to companies which had previously tended to move together (Figure 4).
This is not just confined to the US: while major decorrelations have included US megacap tech, sectors as diverse as European utilities, Iberian and Italian financials, and UK and European food delivery companies have seen significant divergence in returns.
In our view, this situation may well persist. Macro dislocations and a rising cost of capital are forcing investors to return to corporate fundamental analysis in place of a blanket long allocation to risk assets. Businesses are not alike and times of trouble tend to expose this fact. The stock picker’s market could therefore last for a while.
Figure 4. Intra-Sector Divergence
Source: Bloomberg; as of 17 February 2022.
Note: All stocks have been anonymised, and their returns are shown normalised to 100, as of 3 January 2022. The value of investments can go down as well as up. Past performance does not guarantee similar future results.
With contributions from: Henry Neville (Man Solutions – Analyst) and Gilles Gharios (Man GLG – Head of Investment Risk)
You are now leaving Man Group’s website
You are leaving Man Group’s website and entering a third-party website that is not controlled, maintained, or monitored by Man Group. Man Group is not responsible for the content or availability of the third-party website. By leaving Man Group’s website, you will be subject to the third-party website’s terms, policies and/or notices, including those related to privacy and security, as applicable.