Will Inflation Stay High? We Think So
US inflation accelerated to a year-over-year pace of 7% in December, the fastest rate since 1982. How long this inflation surge will last is probably the most pressing investment question in today’s market. After a decade of asset price gains administered via quantitative easing, investors are having to seriously consider the prospect of cold turkey. As we wrote last week , the market is anticipating between three and four rate hikes and the end of QE by midsummer. If inflation stays high, it is almost certain that these rate hikes (and possibly more) will occur in a bid to tame it, which will have consequences in turn for factor rotation and asset class performance.
So, where do inflation numbers go from here?
The first thing we consider is the historical trend of the main components of the US CPI basket. It is worth remembering that the trends are not always consistently inflationary: until the Trump trade war and the coronavirus pandemic, the trend in household goods was decidedly deflationary. Energy is extremely volatile but is around net flat on average, with shelter steadily inflationary. Eat-at-home food prices are much more volatile than compared with restaurants, driven by the hospitality industry being much more fragmented than the food retail industry, and thus less responsive to changing input costs.
We then compare the components’ month-on-month inflation readings for the past two years to the seasonal historical average over about 80 years (Figure 2). The first row are the actual month-on-month readings, while the second is an estimate of what we would seasonally expect. If the actual number is higher than the expected number, the cell is coloured red; if the actual number is lower, the cell is coloured blue.
Our main takeaways over the past two years are that: household goods have seen continuous month-on-month strength since March 2021; used vehicle prices are not seeing any signs of easing; energy prices have just started to fall compared to expectations (although the relief may be short-lived given the rise in oil prices); and food prices (both eat-at-home and eating out) show no signs of abating.
In Figure 3, we model the four major components of the CPI basket (food, shelter, energy and used vehicles), using a series of forward predictors. For the remainder of the basket, we assume a reversion to the seasonal averages of the last cycle (2009- 2019). As can be seen, this suggests that while inflation is likely to roll over through 2022, it will still finish the year well above 5%. Currently, the Street expects 4.6% for the year, so our estimate is a full point higher.
Figure 1. US Inflation Components
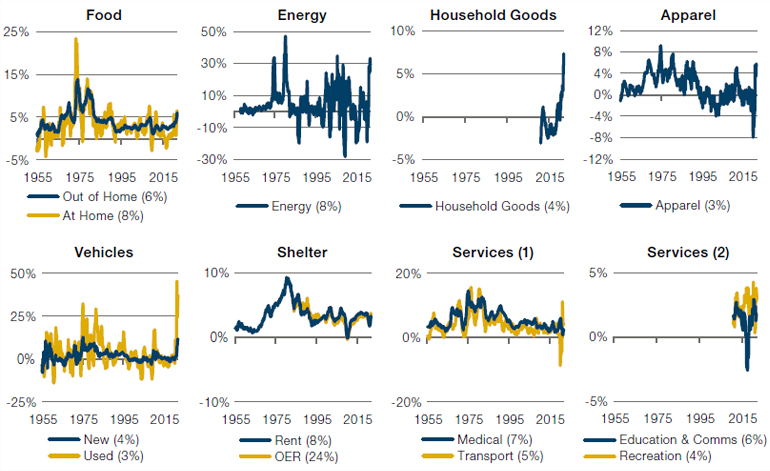
Source: Bureau of Labor Statistics; as of 31 December 2021.
Figure 2. Inflation Components Over the Short Term
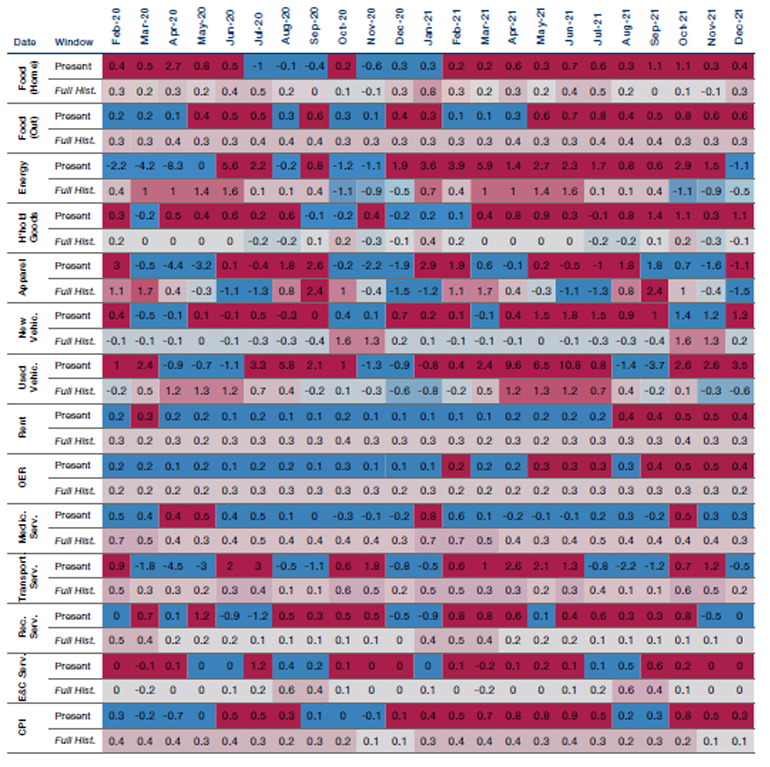
Source: Bureau of Labor Statistics, Bloomberg. Numbers turn red where the MoM reading exceeds the average reading for the equivalent month in the prior cycle (defined 2008-2019, according to the NBER definitions). Numbers turn blue where it is below. Similarly, the cell will turn red where the MoM reading exceeds the average reading for the equivalent month over the full data history (starting in 1954), and blue where it is below. These average readings for the full history are shown in italics as ‘Full Hist’ below the present-day readings. ‘Full Hist’ is coloured in a range from min monthly reading across all components (-1.5, blue) to the max (+2.4, red).
Figure 3. US CPI Projection
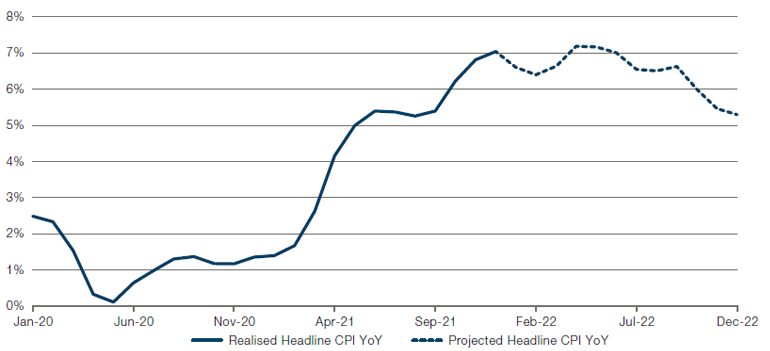
Source: Bureau of Labor Statistics; as of 31 December 2021. Future market and interest rate conditions, among other factors, may affect inflation, and are outside the control of the firm. These future events may materially affect results. Investment decisions should not be made based upon these projections.
Lockstep: Implications of Rising Energy and Interest Rate Correlation
As rising rates and central bank hawkishness are inducing higher volatility in risky assets, investors may have to pay attention to rising correlations between commodities and rates.
Here, we highlight the relationship between crude oil and the US 10-year Treasury yield, which seem to have been moving lockstep as of late (Figure 4). Unsurprisingly, crude and rates plunged together after the Omicron shock in late November and then recovered together as markets began to interpret the new variant as a potential end to the crisis rather than a worse phase of the pandemic. However, with both rates and crude now above their 26 November levels, the relationship may become more perilous for risky assets as investors bid up commodities – either as an inflationary hedge or anticipating increasing demand as economies emerge from the pandemic. Rising commodity prices may begin to feed inflationary fears and further exacerbate the rise in rates.
Figure 5 shows that the correlation between rates and oil is at the highest level of the last five years outside of the initial Covid-19 shock in the first quarter of 2020. While great for energy stocks, Growth stocks may be adversely affected by this rising rate/ rising commodities tango. At a minimum, investors may need to keep a wary eye on commodities as the relationship between rates and rising commodities may introduce more volatility in bonds and risky assets. As oil tends to be a much more volatile asset than bonds or equities, increasing correlation may lead to energy and commodity volatility feeding into other assets classes.
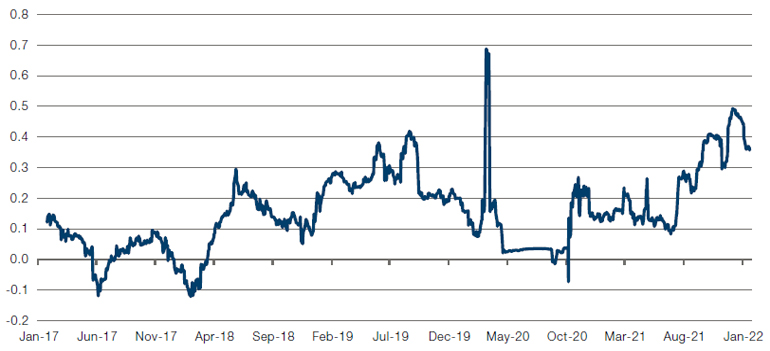
Figure 4. WTI Crude Versus US 10-Year Treasury Index
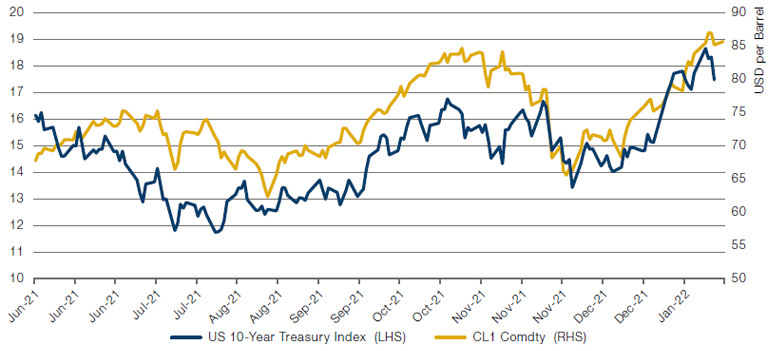
Source: Bloomberg; as of 24 January 2022.
Figure 5. Five-Year Daily Correlation – WTI Crude to 10-Year Treasuries
Source: Bloomberg; as of 24 January 2022.
The Great Rotation: Over Already?
After an autumn of upheavals and rising inflation, how have hedge fund managers risen to the challenge?
Figure 6 shows the spread in performance between Morgan Stanley’s crowding (compiled from hedge fund filings) and short interest baskets and the beta to various factors, with the blue line showing the 63-day rolling beta, and the yellow line showing 21-day beta.
Trades which were popular in early 2021 – such as buying expensive tech stocks, Growth or following 3-month rolling Momentum – have become much less so. In contrast, while Value had a negative beta to crowding, this reversed itself over the course of the autumn, and now is slightly positive.
We would point out that these charts do have an element of staleness baked in, with quarterly and monthly rebalancings in each basket. Still, this doesn’t diminish our main point – much of the hedge fund crowding into tech and Growth had evaporated by the turn of the year, with Value being the major beneficiary.
This observation does not mean the rotation trends that have been impacting returns for the last eight weeks are running out of steam. However, it does suggest that if they continue, the volatility of the rotation will likely diminish, and the damage it will cause to industry returns is likely to moderate.
Figure 6. Factor Betas to Hedge Fund Crowding
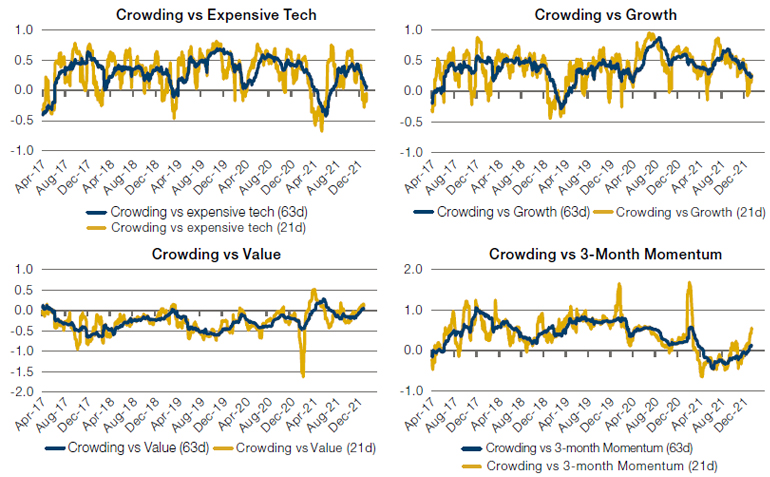
Source: Morgan Stanley, Man GLG; as of 31 December 2021.
With contributions from: Henry Neville (Man Solutions, Analyst), Peter van Dooijeweert (Man Solutions, Managing Director) and Ed Cole (Man GLG, Managing Director – Discretionary Investments)
You are now leaving Man Group’s website
You are leaving Man Group’s website and entering a third-party website that is not controlled, maintained, or monitored by Man Group. Man Group is not responsible for the content or availability of the third-party website. By leaving Man Group’s website, you will be subject to the third-party website’s terms, policies and/or notices, including those related to privacy and security, as applicable.