Value, Momentum, and Ouroboros
Momentum has spent most of the past decade running away from Value. But recently Value seems to have discovered that if you can’t beat them, eat them.
Over the past 25 years, Momentum has more often than not been negatively correlated with Value, but in 2021 we saw that relationship invert (Figure 1). This may surprise anyone who had conflated Momentum and Growth, or even just Momentum and technology stocks given their long positive association. This change merely reflects that factor portfolios are mutable: they offer dynamic exposure to stocks with given characteristics, rather than acting as a static list. Value has gained small-m momentum and so increasingly dominates large-m Momentum, like the ouroboros, the ancient symbol of the dragon eating its own tail.
The other notable effect of this phenomenon has been that Momentum now looks ‘cheaper’ than it has in years. In Figure 2, the y-axis shows the earnings-to-price (E/P) ratio of ‘high’ Momentum stocks minus the E/P of ‘low’ Momentum stocks. In developed markets, all these Momentum signals are now long E/P. In addition, Style momentum is at a historic high, mostly likely due to its high exposure to E/P.
Figure 1. Correlation Between Barra Value and Momentum Factors
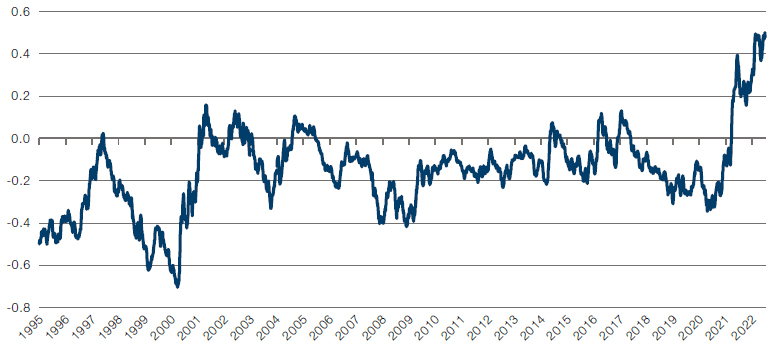
Source: Barra, Man Numeric; as of 30 June 2022. Data cover US universe.
Figure 2. E/P Spread of Momentum (Global Developed Markets Top 3000)
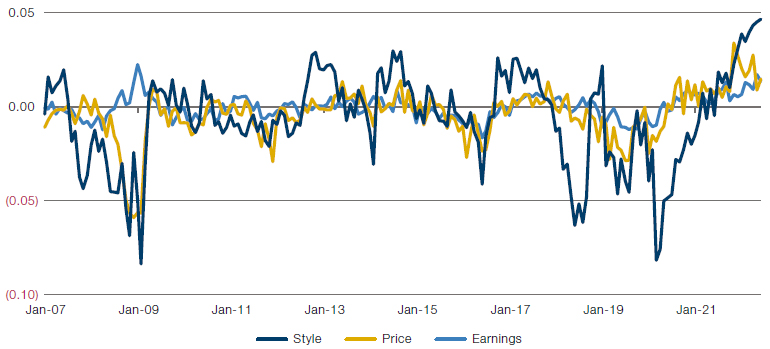
Source: Man Numeric; as of 30 June 2022.
Rates, Returns and the Stock/Bond Correlation
The second quarter was notable for its re-assertion of the stock/bond correlation. Largely negative for the past 24 years, the return of positive correlation between the two traditional asset classes was anything but for most managers. Indeed, the 16% selloff between January and July 2022 in US investment grade (‘IG’) was worse than during the 2020 Covid-19 crash (Figure 3). In our view, pressure from rising rates has swamped the risk on/ risk off dynamic that had previously characterised bond and equity returns.
This dynamic may well persist. As market fears regarding inflation eased in the wake of Fed rate hikes, we saw a continued positive correlation as both equity and credit indices staged a recovery in the early part of Q3. As we have written previously, the stock/bond correlation has been positive throughout most of its history. If the market’s expectation of the direction of rates is now the primary driver of asset returns, then we might continue to expect equities and bonds to keep moving together during the remainder of the year.
Figure 3. Total Return Drawdown – S&P 500 Index, US High Yield, US IG Corporate Credit
Problems loading this infographic? - Please click here
Source: Bloomberg, Man Numeric; as of 10 August 2022.
Emerging Markets Are Diverging Markets
We often use ‘emerging markets’ as a catch-all term, but equity factor returns in the second quarter have given us a healthy reminder that returns – and their underlying drivers – vary widely across the emerging landscape.
So what did well where? We see in Figure 4 that Barra Beta and Residual Volatility suffered in Latin America and Eastern Europe (respectively, the regions most sensitive to commodity prices and exposed to the Russian economy), reflecting risk aversion there. Value and Momentum both exhibited the opposite pattern, with healthy returns in Latin America, more moderate returns in Europe and the Middle East and negative returns in Asia.
Given Asia’s weight in emerging markets, this latter point left Momentum overall in emerging markets down by 14.8% on a sector-neutral basis in June – its worst return since May 2009. On a country-neutral basis, however, Momentum was only down by 4.9%. Emerging markets are far from homogenous.
Figure 4. Regional Barra Factor Efficacy in Q2 2022
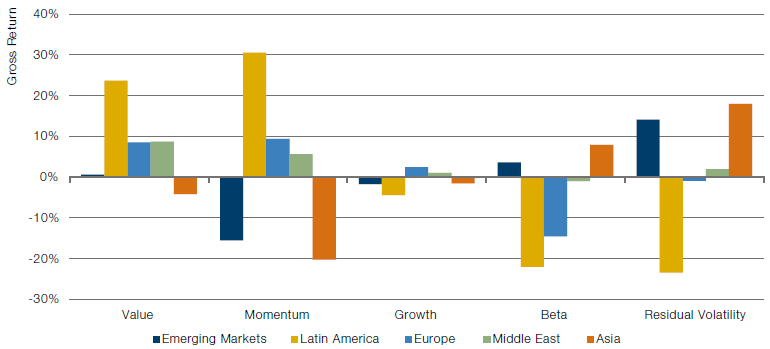
Source: MSCI Barra, Man Numeric; as of 30 June 2022.
With Contributions from: Daniel Taylor (Man Numeric – CIO), John Lidington (Man Numeric – Client Portfolio Manager and Co-Portfolio Manager), Jason Moore (Man Numeric – Head of Client Portfolio Management and Paul Kamenski (Man Numeric – Co-Head of Credit)
You are now leaving Man Group’s website
You are leaving Man Group’s website and entering a third-party website that is not controlled, maintained, or monitored by Man Group. Man Group is not responsible for the content or availability of the third-party website. By leaving Man Group’s website, you will be subject to the third-party website’s terms, policies and/or notices, including those related to privacy and security, as applicable.