Earnings Revisions: The Sweet Spot?
The earnings revisions ratio – or the ratio of earning upgrades to downgrades – is at the highest reading since 2000 (Figure 1). All things being equal, the higher the ratio, the higher the earnings surprise to the upside – which bodes well for stock prices.
However, when we examine any kind of surprise indicator, direction is as important as level. The ratio is currently positive but, crucially, is also improving. Our analysis indicates that 1-, 3- and 6-month forward returns are strongest in this period, with the largest gap between unconditional returns and conditional returns (Figure 2, red box). This applies both to returns at the index level (MSCI ACWI), but also to the outperformance of cyclical stocks versus defensives.
A note of caution: indicators such as the earnings revisions ratio do tend to have an element of mean reversion. As analysts revise expectations further and further upwards, it becomes progressively harder to surprise positively. Nevertheless, earnings revisions imply that now is likely a good time to own cyclicals – and equities more generally.
Figure 1. Earnings Revision Ratio
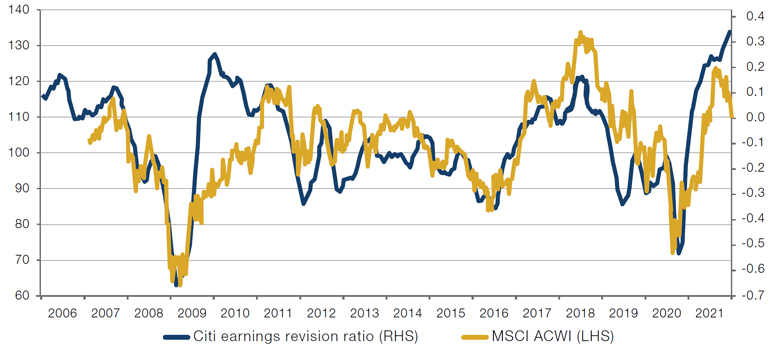
Source: Citi, Man GLG, Bloomberg; as of 20 July 2021.
Note: The earnings revision ratio covers a global universe and smoothed to a 13-week moving average.
Figure 2. Conditional and Unconditional Forward Returns
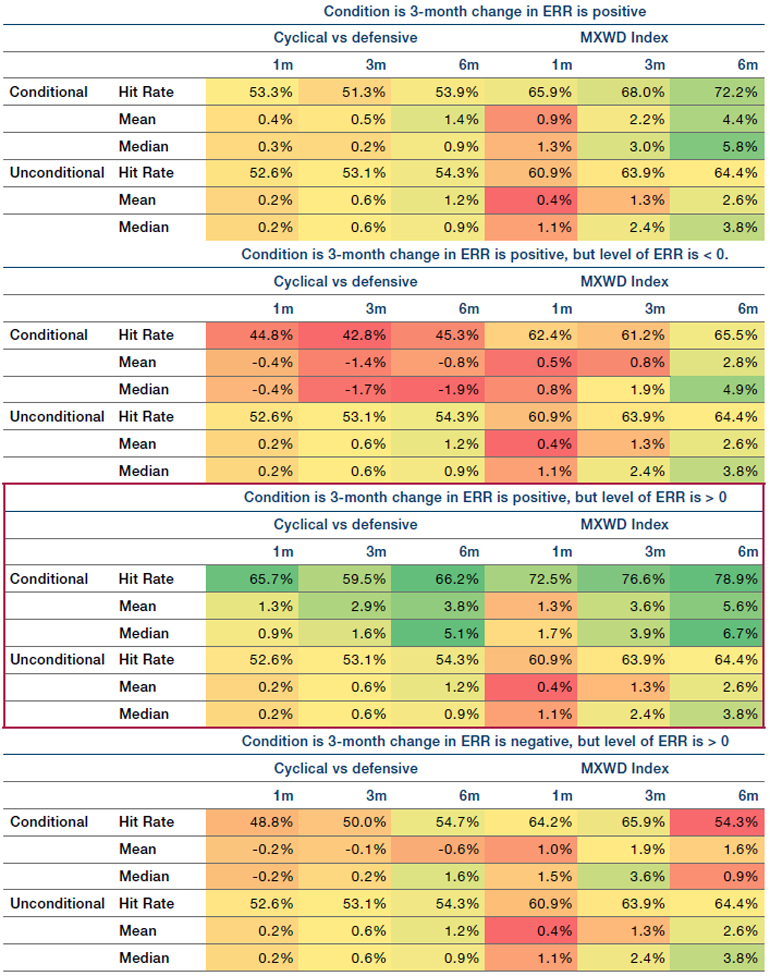
Source: Man GLG; as of 27 July 2021.
After the Deluge: US Equity Flows
In the first six months of the year, US equities experienced USD267 billion of inflows from mutual funds and ETFs, according to EPFR’s data. To put that in context, that’s USD72 billion more than was achieved in the whole of 2013, the previous record year.
The speed of this liquidity deluge is slowing, however. As Figure 3 shows, the steep gradient of the inflow line has been moderating over the past couple of months. This has dovetailed with a number of other sentiment indicators we watch becoming more measured. The AAII Bulls Minus Bears survey, which tracks sentiment of largely retail investors, has come back from 37 in April to touch zero at one point in the last month, indicating that there are now as many bears as there are bulls. Moreover, the Bloomberg Consumer Comfort survey is showing that the general populace is still at a level of economic ease that is about a fifth lower than where it was prior to Covid.
All in all, while it would be understandable to get some vertigo from the steepness of current valuations, one argument for a more benign pathway is that sentiment does not seem to be at a level of champagne popping exuberance that often presages a correction.
Figure 3. US Equity Inflows
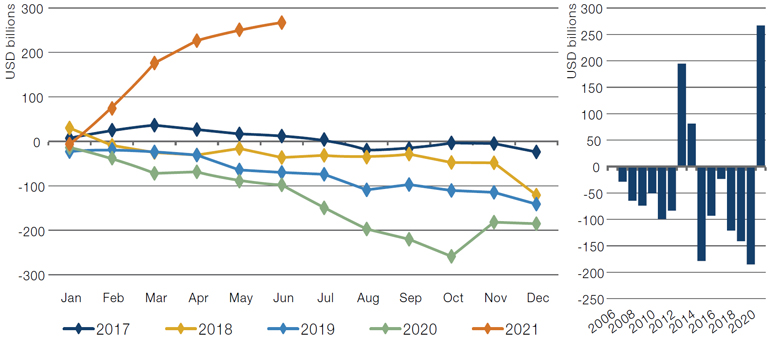
Source: EPFR. Left hand charts show cumulative net flows for the last 5 discreet years. Right hand charts show the total flow by calendar year for the last 15 years.
With contributions from: Ed Cole (Man GLG, Managing Director – Discretionary Investments) and Henry Neville (Man Solutions, Analyst).
You are now leaving Man Group’s website
You are leaving Man Group’s website and entering a third-party website that is not controlled, maintained, or monitored by Man Group. Man Group is not responsible for the content or availability of the third-party website. By leaving Man Group’s website, you will be subject to the third-party website’s terms, policies and/or notices, including those related to privacy and security, as applicable.