Coming Soon: A Market Shock?
The blue line in Figure 1 shows the evolution of Treasury deposits held at the Federal Reserve. This is money that remains outside of the monetary supply up until the Treasury spends it and makes payments. When that happens, this operates in exactly the same way as quantitative easing: injecting pure liquidity in the financial system. During the normal operations of the government, inflows and outflows to/ from this account balance themselves and do not have a significant impact on financial conditions (compared to when the Treasury collects taxes and deposits proceeds at the Fed, which operates as a factor tightening financial conditions).
Back in 2020, when the Trump administration toyed with the idea of passing a large rescue package, the Treasury undertook a massive increase in bond issuance (largely via T-bills) to accumulate the resources required to fund such a fiscal package. At the time, the Fed bought almost all of that issuance in the secondary market. As a result, the increase in the cash balance kept by the Treasury at the Fed did not have tightening consequences for the economy. Indeed, the Fed purchased around USD3 trillion worth of bonds between early March and early June of 2020, as illustrated by the yellow line in Figure 1. Of that, the US Treasury deposited a net USD1.47 trillion back at the Fed.
When, by February 2021, the Biden Administration managed to pass the large recovery package, the Treasury ramped up spending. That spending and the constraint imposed by the debt ceiling drove the Treasury to spend USD1.55 trillion in the eight months between mid-February and mid-October, when it finally ran out of money. This is an average monthly liquidity injection of USD194 billion per month.
Figure 1. US Treasury Cash Balance Held at the Fed Versus Fed Purchases
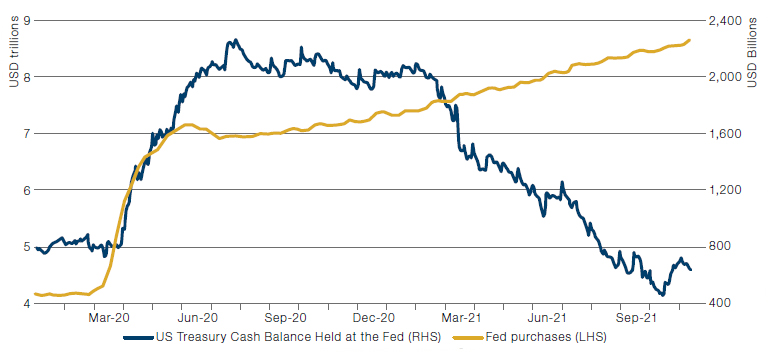
Source: Bloomberg; as of 27 October 2021.
In addition to this, the Treasury substantially decreased its net issuance of debt as it opted to withdraw the cash that it had deposited at the Fed. The blue bars in Figure 2 shows the evolution of Treasury monthly issuance net of the Fed QE purchases. In the first nine months of 2021, net issuance after Fed QE was negative, by USD61 billion.
Figure 2. Net Treasury Issuance and Liquidity Injection From Treasury Account at the Fed
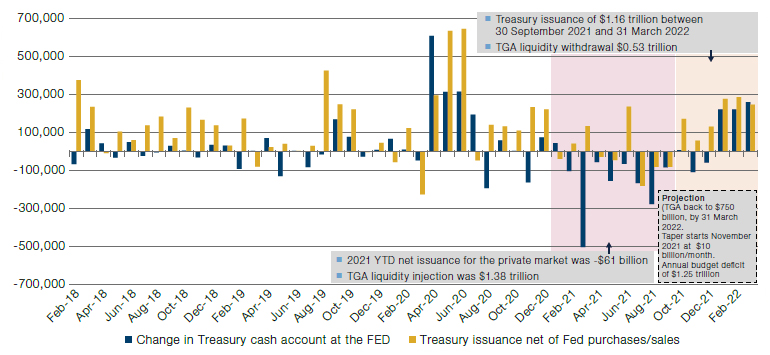
Source: Haver Analytics, Man GLG, Goldman Sachs; as of 27 October 2021.
From October onwards, there is no more cash to continue injecting liquidity. As such, we expect a substantial increase in net issuance by the Fed, estimated at USD1.16 trillion in the last quarter of 2021 and first quarter of 2022.
Figure 3 puts everything together in one picture. The blue bars show the combination of net Treasury issuance after the Fed purchases plus/minus liquidity injections from the Treasury cash account. This amount of net issuance and liquidity drainage has never happened before.
Figure 3. Combined Effect of Net Issuance to Private Market + Treasury Liquidity Injection / Drag
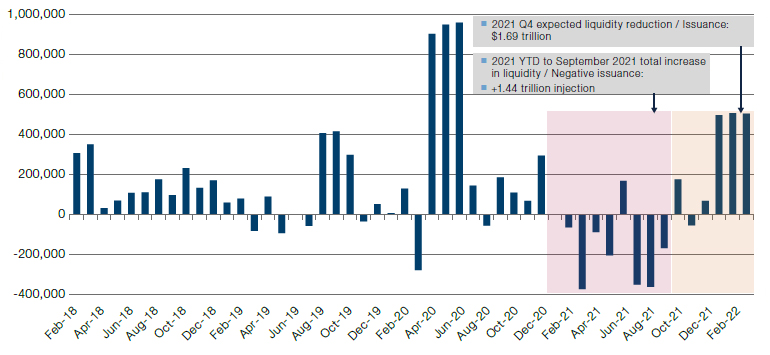
Source: Haver Analytics, Man GLG, Goldman Sachs; as of 27 October 2021.
Last week, we showed that historically tapering has had no discernible impact on asset prices. That statistical analysis did not take the current treasury funding backdrop into account. We believe the current substantial fiscal injection, combined with QE, plus the normalisation of the savings rate will keep inflation higher than what the Fed would like to see for longer. We do not believe that any of these considerations are what explain the behavior of US long-term rates and the derived behavior of risk assets in the second and third quarters of 2021. If we are right, then we should be about to see a significant shock in the markets.
Inflation: Permanent or Transitory? Market Says…..
The US 5-year 5-year – which measures investor expectations of what the 5-year inflation rate will be in five years’ time – is currently at 2.21% (Figure 4). This is despite US CPI leaping to 6.2% year-on year in October, the highest since November 1990. Indeed, US CPI has now been above 5% – a level we determine as being in an inflationary regime – for the past six consecutive months.
With all the talk about permanent inflation, the 5-year 5-year is below its 20-year average and well under peaks seen during the 2000-2013 period. With the 5-year 5-year being a good proxy for market expectations about the long-term direction of inflation, the market, at least, is expecting inflation to be transitory.
Figure 4. US 5-Year 5-Year
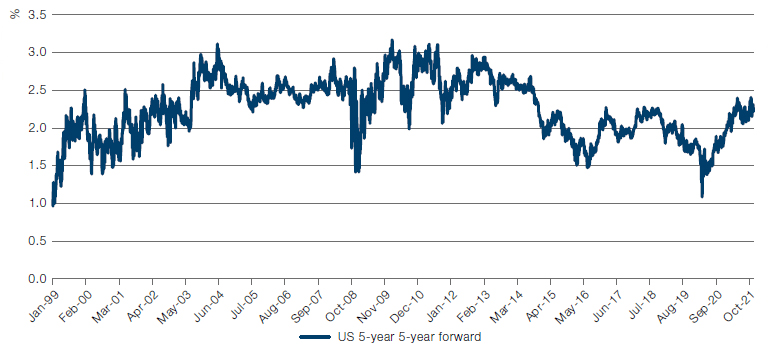
Source: Bloomberg; as of 16 November 2021.
With contribution from: Guillermo Osses (Man GLG, Head of Emerging-Market Debt Strategies) and Peter van Dooijeweert (Man Solutions, Managing Director – Multi-Asset Solutions)
You are now leaving Man Group’s website
You are leaving Man Group’s website and entering a third-party website that is not controlled, maintained, or monitored by Man Group. Man Group is not responsible for the content or availability of the third-party website. By leaving Man Group’s website, you will be subject to the third-party website’s terms, policies and/or notices, including those related to privacy and security, as applicable.