ARTICLE | 2 MIN | VIEWS FROM THE FLOOR

What Does a Bull Flattener Signal for Equities?

June 29, 2021

This material is intended only for Institutional Investors, Qualified Investors, and Investment Professionals. Not intended for retail investors or for public distribution.

A bull flattener – what happens next?

What Does a Bull Flattener Signal for Equities?

As the dust settles after the Monetary Policy Committee ('MPC') meeting, it’s worth thinking about what the reaction means – and particularly the flattening of the yield curve (Figure 1).

Yield curves flatten in one of two ways: a bull flattener, where long-term interest rates fall quicker than short-term rates; and bear flatteners, where short-term rates rise more than long-term rates.

What started as a bear flattener between March and Wednesday 16 June morphed into a bull flattener beginning on Thursday 17 June as the market digested the news from the MPC (Figure 2).

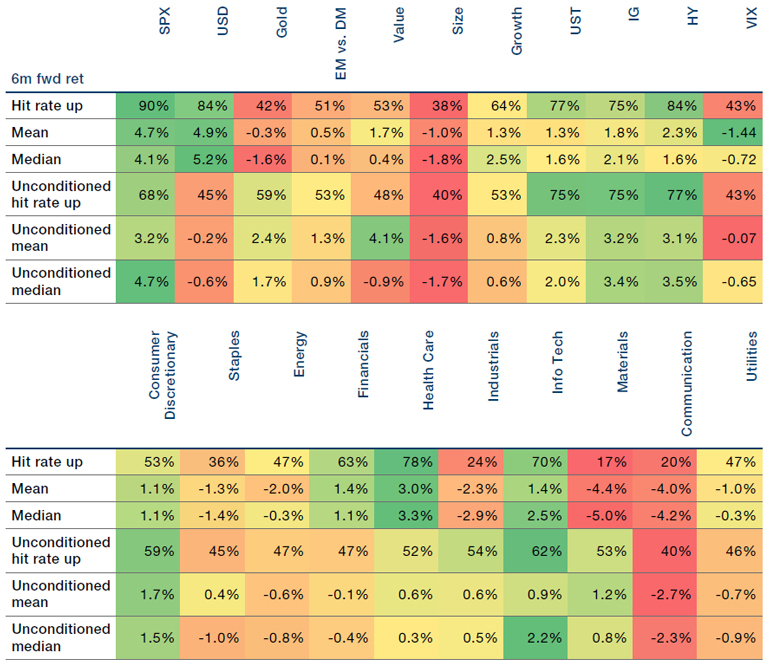
What does this herald over the short and medium term? Figure 3 shows the 6-month forward returns to a variety of assets after both bull and bear flatteners. Bull flatteners tend to be a positive signal for equities, the US dollar and Growth versus Value. Specifically, bull flatteners are good for long-duration sectors such as health care and IT. Conversely, bear flatteners are bad for equities, better for Value and good for gold.

Figure 1. US 30-5 Year Spread

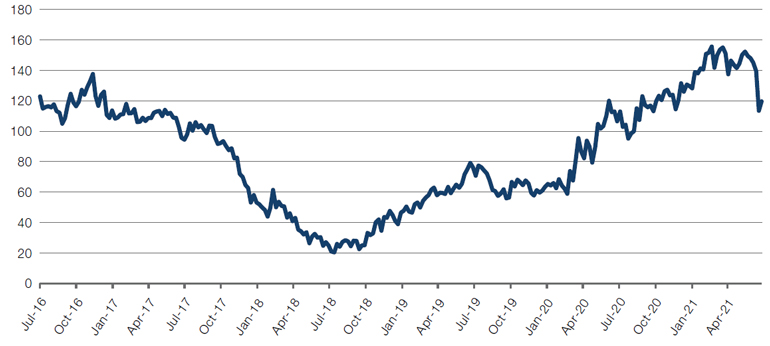
Source: Bloomberg; as of 25 June 2021.

Figure 2. US Yield Curve Versus 1-Week & 1-Month Change

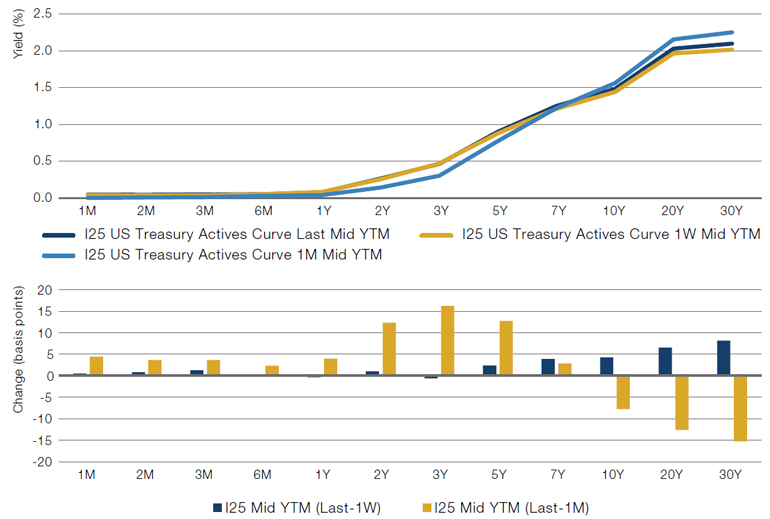
Source: Bloomberg; as of 21 June 2021.

Figure 3. Six-Month Forward Returns – Bull & Bear Flatteners

Bull flattener beginning Thursday 17 June

Bear flattener between March and Wednesday 16 June

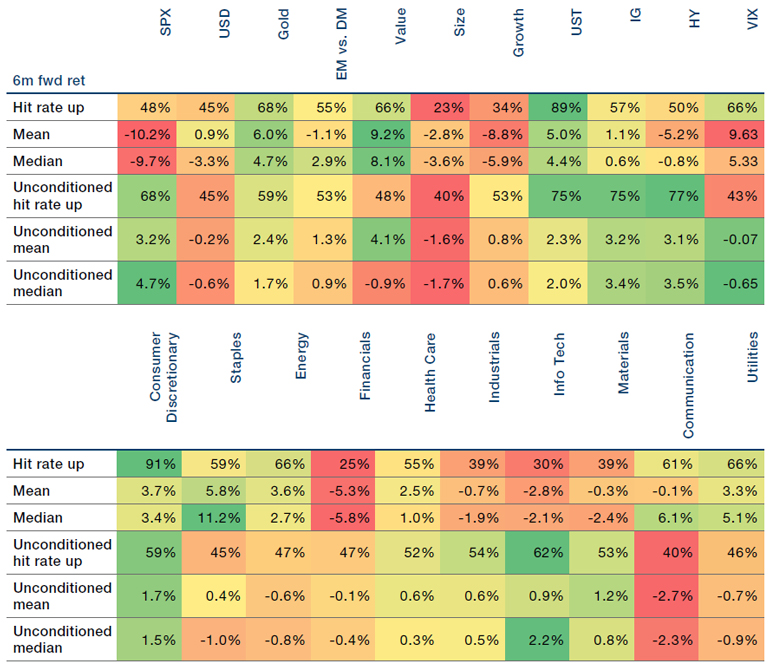
Source: Man GLG; as of 21 June 2021.

China Credit: The Property Proxy

Back in March, we spoke about how the robustness of property sector in China was sitting at odds with the slowing Chinese credit impulse (which shows the change in the growth rate of aggregate credit as a percentage of GDP): as a credit-sensitive sector, a decelerating credit impulse should result in slowing construction.

This anomaly now appears to be correcting itself: property sales by floor area rose 9.2% in May from a year earlier, while new construction starts by floor area fell 6.1% in the month (Figure 4). Indeed, new construction starts by floor area is now negative not only year-on-year, but over a 2-year lookback period, which strips out any lingering base effects from the coronacrisis.

Figure 4. China Property Sales and Starts

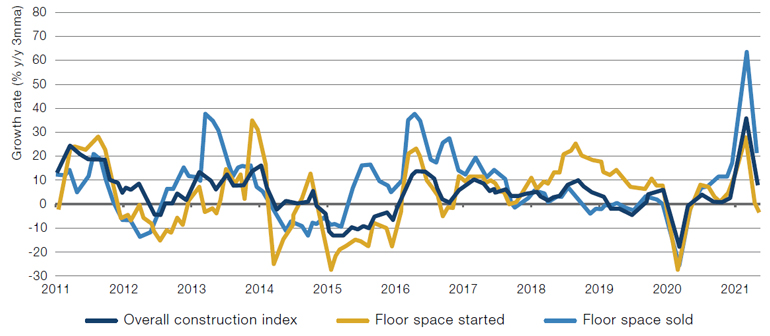
Source: Credit Suisse; as of May 2021.

With contribution from: Ed Cole (Man GLG, Managing Director – Discretionary Investments).

For further clarification on the terms which appear here, please visit our Glossary page.

This information is communicated and/or distributed by the relevant Man entity identified below (collectively the "Company") subject to the following conditions and restriction in their respective jurisdictions.

Opinions expressed are those of the author and may not be shared by all personnel of Man Group plc (‘Man’). These opinions are subject to change without notice, are for information purposes only and do not constitute an offer or invitation to make an investment in any financial instrument or in any product to which the Company and/or its affiliates provides investment advisory or any other financial services. Any organisations, financial instrument or products described in this material are mentioned for reference purposes only which should not be considered a recommendation for their purchase or sale. Neither the Company nor the authors shall be liable to any person for any action taken on the basis of the information provided. Some statements contained in this material concerning goals, strategies, outlook or other non-historical matters may be forward-looking statements and are based on current indicators and expectations. These forward-looking statements speak only as of the date on which they are made, and the Company undertakes no obligation to update or revise any forward-looking statements. These forward-looking statements are subject to risks and uncertainties that may cause actual results to differ materially from those contained in the statements. The Company and/or its affiliates may or may not have a position in any financial instrument mentioned and may or may not be actively trading in any such securities. Unless stated otherwise all information is provided by the Company. Past performance is not indicative of future results.

Unless stated otherwise this information is communicated by the relevant entity listed below.

United States: To the extent this material is distributed in the United States, it is communicated and distributed by Man Investments, Inc. (‘Man Investments’). Man Investments is registered as a broker-dealer with the SEC and is a member of the Financial Industry Regulatory Authority (‘FINRA’). Man Investments is also a member of the Securities Investor Protection Corporation (‘SIPC’). Man Investments is a wholly owned subsidiary of Man Group plc. The registration and memberships described above in no way imply a certain level of skill or expertise or that the SEC, FINRA or the SIPC have endorsed Man Investments. Man Investments Inc, 1345 Avenue of the Americas, 21st Floor, New York, NY 10105.

This material is proprietary information and may not be reproduced or otherwise disseminated in whole or in part without prior written consent. Any data services and information available from public sources used in the creation of this material are believed to be reliable. However accuracy is not warranted or guaranteed. © Man 2025