Be Warned: A Bond Market Selloff
After peaking at 1.78% at the end of March, US 10-year Treasury yields have declined, despite a larger-than-forecasted acceleration in inflation. There are two schools of thought for this: on one hand are those who believe that the Federal Reserve will be proved correct and that inflation is temporary; on the other are those who believe that the Fed will commit a policy mistake and trigger a recession, resulting in the Japanification of the US economy. The performance of risk assets such as equities and credit spreads in the second quarter would support the former thesis rather than the later.
We beg to differ. In fact, neither of these reasons explain the behaviour of US long-term rates and the derived behaviour of risk assets during the second quarter, in our view.
Figure 1 shows the evolution of the Treasury deposits held by the Fed. This is money that remains outside of the monetary supply up until the minute the Treasury spends it. When that happens, this operates exactly in the same way quantitative easing operates, injecting pure liquidity in the financial system. During the normal operation of the government, inflows and outflows to/from this account balance themselves and do not have a significant impact in financial conditions (in comparison, when the Treasury collects taxes and deposits the proceeds at the Fed, that operates as a factor tightening financial conditions). This is why Figure 1 shows no large changes in the cash balances between early 2018 and March 2020. It’s worth noting here that back in 2020 – when the Trump administration toyed with the idea of passing a large rescue package – the Treasury undertook a massive increase in bond issuance (largely via T-bills) to accumulate the resources required to fund such a fiscal package. At the time, the Fed bought the vast majority of the issuance in the secondary market, and as such, the increase in the cash balance kept by the Treasury at the Fed did not produce a tightening effect for the economy.
Then in February 2021, when the Biden administration passed the American Rescue Plan Act, cash deposits fell. The decline of USD876 billion in little less than four months (from mid-February to mid-June) equates to an average monthly liquidity injection of USD220 billion per month, or 1.8x the Fed purchases of Treasuries and mortgage-backed securities (‘MBS’) under its QE program.
Figure 1. US Factors Absorbing Reserve Funds Treasury Deposits at the Fed
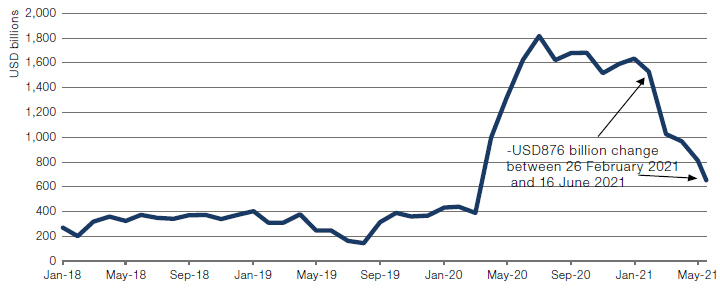
Source: Man GLG; as of 24 June 2021.
In addition, the Treasury substantially decreased its net issuance of debt, and seems to have opted to withdraw the cash that it had deposited at the Fed. Figure 2 shows the evolution of Treasury monthly issuance net of the Fed QE purchases. From an average monthly net issuance after Fed purchases of USD290 billion per month, the net issuance fell to USD163 billion in April and May.
Figure 2. Net Monthly Treasury Issuance After Fed QE Purchases
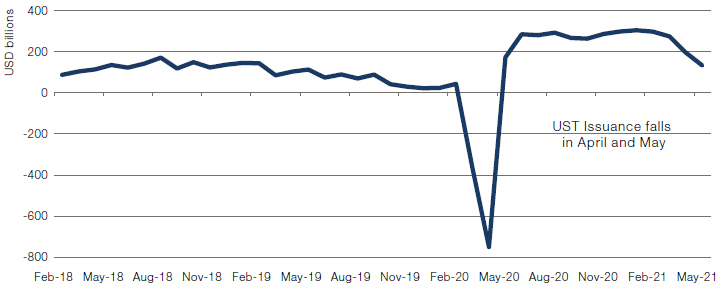
Source: Man GLG; as of 31 May 2021.
So, in the 4-month period between late February and late June, there was a massive injection of liquidity, coupled with a massive decrease in the issuance of UST hitting the market. No wonder, then, that UST yields fell from late March to June. The problem is that the Treasury has indicated that it wants to run the cash level at around USD700 billion going forward. Thus, it is unlikely that the supportive conditions experienced in the second quarter will continue. We might have one final injection of liquidity if the Treasury is forced to run down its cash deposits due to a failure to roll over the debt ceiling quickly.
However, at the current rate of cash burn, even after accounting for delayed tax payments, we estimate that the Treasury should run out of money over the next one or two months. Once that happens, net UST issuance will go back to USD220 billion per month, assuming that the Fed does not taper (otherwise the net issuance hitting the market would be larger). At that point, supportive liquidity conditions will go away and fundamentals will begin to matter once more. If the debt ceiling is not rolled over soon, the Treasury will have to issue even more than USD220 billion per month to rebuild its cash cushion. History shows us that when a debt ceiling rollover has been required, market selloffs have occurred.
If we are right, then we should expect a significant market shock within the next few months. Be warned.
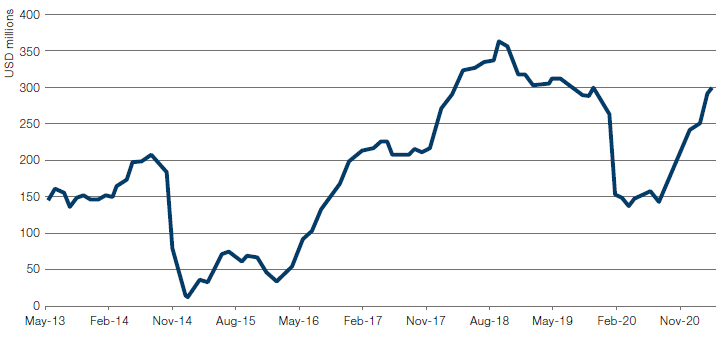
Figure 3. Net Treasury Issuance and Liquidity Injection From Treasury Account at the Fed
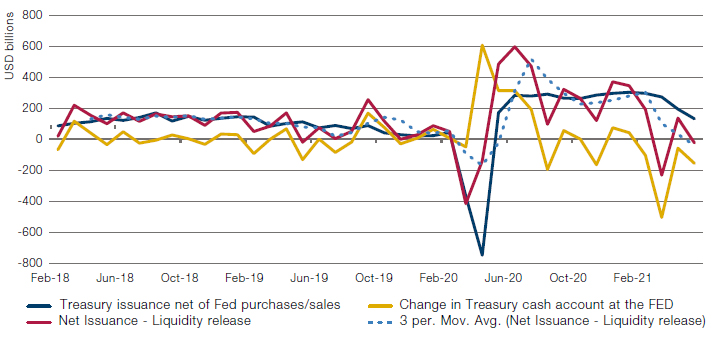
Source: Man GLG, Haver Analytics, Bloomberg; as of 24 June 2021.
Oil, Gas and the Supply Bottleneck
The publication of the Federal Reserve Bank of Dallas’s Energy Survey has made for some interesting reading, detailing how ESG regulation is limiting the capacity to attract any capital in the oil and gas industry. The most eye-catching vignette was how a firm – which had relationships with 400 institutional investors, of which 100 were close – could find only one willing to give new capital to oil and gas investment.
This trend was evident before the coronavirus pandemic: the resource replacement ratio, which indicates that new discoveries were only replacing 1-in-7 barrels of oil being consumed in 2019, compared with 1-in-3 in 2013; in other words, by 2019, there was a serious lack of new exploration. There is little sign of appetite for new capital expenditure, as estimates for total capital expenditure for the MSCI ACWI Oil & Gas industry have only modestly stabilised after the collapse during the pandemic, and the long decline from 2014, when the Saudis drove the price down in a bid for market share (Figure 4). The unwillingness to embrace capital expenditure is despite the sharp recovery in industry free cash flow (Figure 5), and speaks to anxiety about risks to price in the context of OPEC spare capacity, and ESG-induced risks of stranded assets.
In addition to the potential supply constraints, oil consumption is trending back up. Driving conditions, which represent 26% of oil demand globally, are now above pre-pandemic levels.1 And while aviation is still below average, the trend is up.
We are therefore still looking at a world of reinvigorated demand and long-term challenges to supply. Could we see more sustained price inflation in oil over the medium term?
Figure 4. MSCI ACWI Oil & Gas Capex Spend
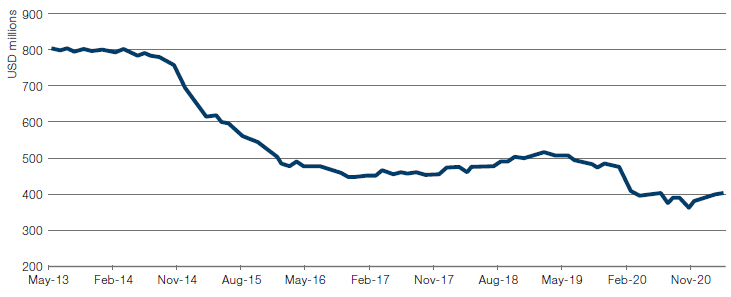
Source: Bloomberg; as of 30 June 2021.
Figure 5. MSCI ACWI Oil & Gas Free Cash Flow to Firm
Source: Bloomberg; as of 30 June 2021.
Durables, Services and the Changing Make-Up of Demand
Driven in part by stimulus checks, nominal spending on durable goods in the US was running at about USD350 billion above the post-Global Financial Crisis trend, which is about six years of pre-pandemic growth in durables consumption.
We’ve previously written about how this spike in the ratio of durable goods to services spending would lead to a hangover in some goods’ consumption that may last some time as the economy recovers.
We are already starting to see evidence of that hangover: US PCE expenditures for May showed how spending on durable goods declined 2.8% month-on-month, while spending on services is picking up (Figure 6). And this trend is set to continue: as pandemic fears dissipate, consumers are likely to shift more of their spending money from goods to services (such as entertainment and travel).
Figure 6. US Personal Consumption Expenditures
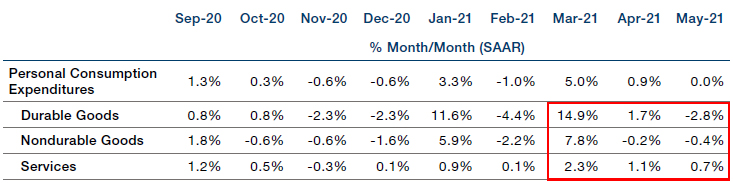
Source: Bureau of Economic Analysis; as of May 2021.
With contribution from: Guillermo Osses (Man GLG – Head of Emerging Market Debt Strategies) and Ed Cole (Man GLG, Managing Director – Discretionary Investments).
1. Source: Morgan Stanley.
You are now leaving Man Group’s website
You are leaving Man Group’s website and entering a third-party website that is not controlled, maintained, or monitored by Man Group. Man Group is not responsible for the content or availability of the third-party website. By leaving Man Group’s website, you will be subject to the third-party website’s terms, policies and/or notices, including those related to privacy and security, as applicable.