The Option Markets’ Take on Equity/Bond Correlations1
The market has increasingly been focused on recent equity/bond correlations and the potential risk for both equities and bonds to sell off together. Correlations are increasing (Figure 1), leaving investors worried about the protective nature of bonds and potentially needing to find ways to hedge risk for both bonds and equities.
Beginning 10 May, equities and bonds moved in tandem for seven consecutive days, including the large declines on the date of the CPI release which showed higher than expected inflation. In fact, rolling 60-day correlations are at the highest level since the 1990s, which may make investors wonder what lies ahead.
Predicting future correlations is, at best, challenging; however, the derivatives market has a means for assessing market expectations for correlations going forward. This comes in the form of S&P 500 Index options whose payoff is contingent on moves in rates. An investor who fears rising rates and precipitates large equity declines may choose to buy equity puts. However, the cost of equity puts may be more than the investor might wish to spend. To cheapen the option, one might add a contingency that the put will only pay off if rates are above a certain threshold.
Since 1997, virtually every major selloff has been accompanied by declines in rates. Adding this higher-rates contingency goes against the recent ‘natural’ order of things and as such, the option will trade significantly more cheaply than a put without the contingency. It does require the investor to be very right about the simultaneous declines of bonds as any decline in rates will render the option worthless. The amount of the discount for the put option contingent on higher rates depends the partially on the volatility of bonds, but mainly on the correlation between bonds and equities. When equity/bond correlations are negative, this option has traded with as much as an 85% discount to outright index puts. While this seems like a great bargain, they have proven to be cheap for a reason, in that the rising rates/falling equities combination has failed to materialise in almost any window.
With that backdrop, it is interesting to note what the option market is expecting from here in terms of future bond/equity correlation. Given equity declines have often come after data that appears to be inflationary, it should be unsurprising to find that dealers are now pricing correlation between equities and bonds to be positive, but in the range of 0.25-0.35 going forward. The level is still below recent realised correlation of 0.52, but quite high relative to most periods in the 2000s (when dealers routinely used levels like -0.30 to -0.40 to price options).
In short, while higher than the recent past, it seems option market makers do not expect the recent high levels of correlation to be sustained. This is not out of line with notions of recent spikes in inflation being transitory; however, compared to periods in the 1980s, the correlation may be too low. As such, while investors betting on normalisation of equity/bond correlations to what was experienced during the 2000s will not find these options interesting, those with bigger fears of inflation and the damage inflation may inflict on equities, may well find the levels too cheap.
Similarly, long duration stocks (high growth/technology stocks) may react positively to falling commodity prices in another unusual correlation change.
Figure 1. 60-Day Correlation Between S&P 500 Index and 10-Year Treasury Futures
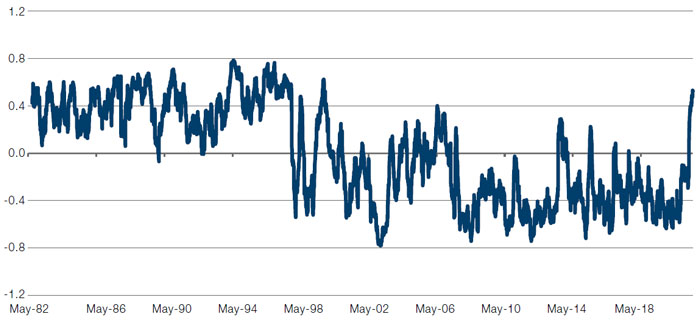
Source: Bloomberg; as of 19 May 2021.
Stalling Retail Sales: Not a Concern
US retail sales were flat in April, missing economists’ media forecast for a 1% gain. The stall in the US retail sales followed a 10.7% gain in March – the second-largest since 1992 – as Americans were handed stimulus payments.
Is this a sign of headwinds in the economy?
Our answer is not necessarily. Reopening, and economic normalisation should see consumers begin to shift more of their spending money from goods to services (such as entertainment and travel) as pandemic fears dissipate.
Indeed, Figure 2 shows the spike in the ratio of durable goods to services spending since the middle of 2020 as Americans stayed home. In fact, nominal spending on durable goods is running at about USD350 billion above the post-Global Financial Crisis trend, which is about six years of pre-pandemic growth in durables consumption. All that time at home with fewer spending options has brought several years of consumption forward. As the economy normalises, some of that front loading will lead to a hangover in some goods’ consumption that may last some time. And it will not necessarily speak to a weak economy overall.
Figure 2. Spike in the Ratio of Durable Goods to Services Spending
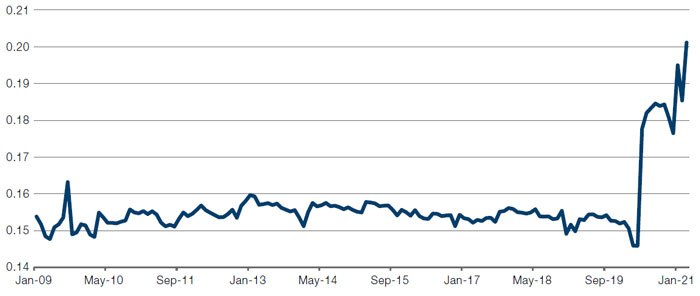
Source: Bloomberg; as of 31 March 2021.
High Yield Stocks: Larger Discount Than Usual
The low-growth nature of high yield stocks historically makes them trade at lower-than-market multiples.
As expectations grew for the US economy to recover from the Covid-19 pandemic, high yield stocks outperformed in the first quarter. However, they are still trading at a 38% discount to the rest of the market, versus the longer-term average of 30% (Figure 3).
Figure 3. Ratio of the P/E of the Highest Yield Quintile Versus the Rest of the Market
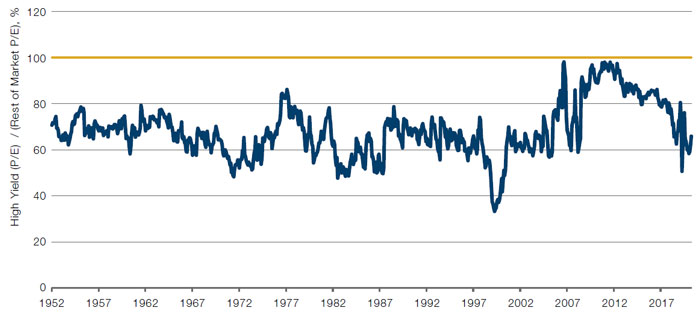
| Long-term average | 68.3% |
| 30-year average | 71.6% |
| Last 36 months | 69.8% |
| Last 3 months | 62.3% |
Source: Man Numeric, Bloomberg; as of 31 March.
US Top 1,000 stocks.
With contribution from: Peter van Dooijeweert (Man Solutions, Managing Director), Ed Cole (Man GLG, Managing Director – Discretionary Investments) and Dan Taylor (Man Numeric, CIO).
1. Source: Bloomberg.
You are now leaving Man Group’s website
You are leaving Man Group’s website and entering a third-party website that is not controlled, maintained, or monitored by Man Group. Man Group is not responsible for the content or availability of the third-party website. By leaving Man Group’s website, you will be subject to the third-party website’s terms, policies and/or notices, including those related to privacy and security, as applicable.