The End of the Big Short?
In the aftermath of the short squeeze by retail day traders, there was one question being asked on the Man Group trading floor: is it profitable to short stocks which have elevated short interest?
In our view, the answer is, in short, no (pun intended). Figure 1 shows the return of a strategy which shorts those stocks with the highest short interest, and goes long those with the least short interest. Whilst this strategy has been highly profitable for most of the 2010s, it has been roughly flat in Europe since 2019 (top chart), and has recently become unprofitable in the US (bottom chart).
However, note that the returns to this strategy come from both legs of the trade: Figure 2 shows the cumulative returns based on short interest by quintile, with both regions showing returns on the long side as well as the short.
What is interesting is that the returns to shorting are independent of a factor bias; a factor neutral version of the short interest strategy in both Europe and the US showed a similar return profile to the original short interest strategy – flat or negative (Figure 3).
In our opinion, for now at least, it seems the days of a big, crowded short trade may be over.
Figure 1. Cumulative Return of an L/S Short Interest Strategy – Europe Versus US
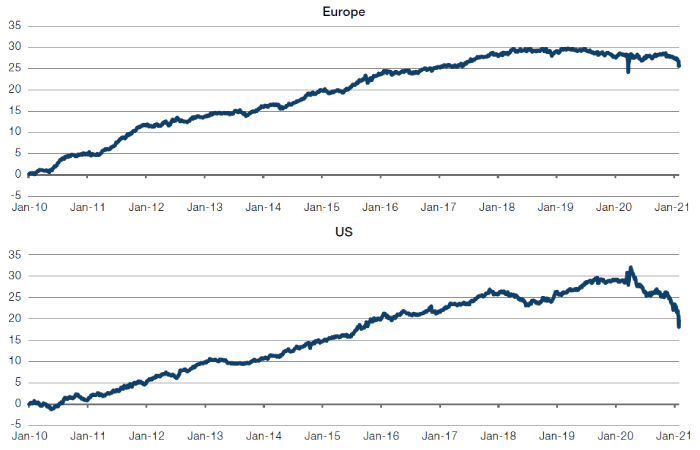
Source: Bloomberg, Man GLG; as of 3 February 2021.
Figure 2. Cumulative Relative Return of Stocks By Utilisation Quintile
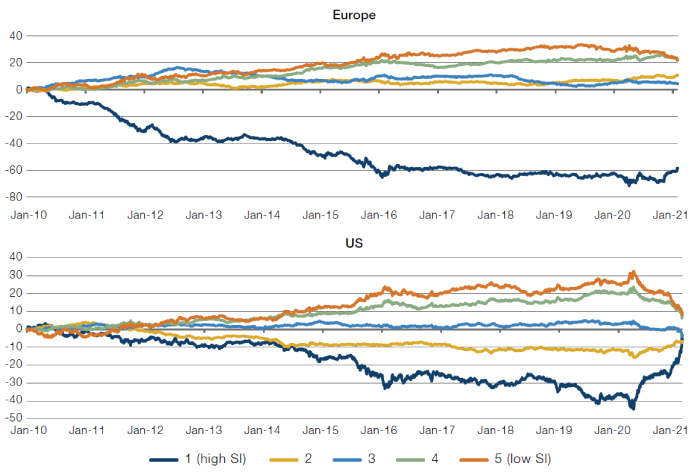
Source: Bloomberg, Man GLG; as of 3 February 2021.
Figure 3. Simple Utilisation L/S Strategy Versus Factor Neutral Utilisation L/S Stategy
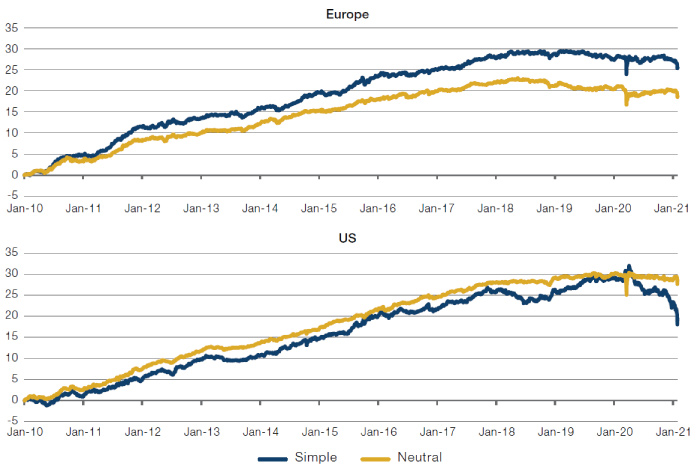
Source: Bloomberg, Man GLG; as of 3 February 2021.
Missing: The Final Piece of the Inflation Puzzle
When we conceptualise the market cycle, a key element is the transition from price inflation to wage inflation. In our eyes, it is only when we see wage inflation that we can identify that an inflationary trend is entrenched: commodity prices may fluctuate, but when wages rise, unit labour costs start to eat into corporate margins, with a subsequent effect on interest rates and hastening the end of the cycle.
We’ve previously commented on how we are seeing a sustained rise in the cost of raw materials, with the ISM Manufacturers Prices Paid index rising sharply over the past few months, reaching its highest level since March 2011 (Figure 4).
However, this is yet to feed through into wages. Figure 5 shows the returns to a long/short strategy which buys the S&P 500 Index and sells those companies with a higher than average wage bill as a percentage of its total cost base. Currently the indicator is showing that these companies with high relative labour costs are outperforming the wider market. One reason for this might be that investors are not yet concerned that wage inflation is crystallising, no doubt looking to recent disappointments in non-farm payrolls and initial jobless claims.
Figure 4. ISM Manufacturers Prices Paid Index
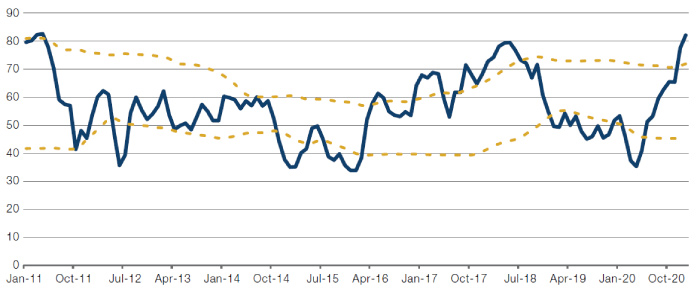
Source: ISM Manufacturers, Man Solutions; as of 5 February 2021. Note: Yellow dashed lines are moving averages +/- 1 standard deviation on a 3-year lookback.
Figure 5. Returns (YoY), S&P 500 Versus High Wage Companies Long/Short Strategy
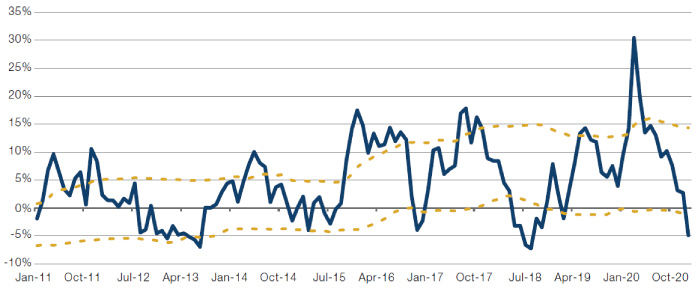
Source: Man Solutions; as of 5 February 2021. Note: Yellow dashed lines are moving averages +/- 1 standard deviation on a 3-year lookback.
Earnings Revisions: Not Yet in the Price
The sell-side has traditionally been a bullish place. Historically, this has meant that the earnings revisions ratio, calculated as:
(# upgrades - # downgrades) / total # of estimatestypically tend to be negative as sell-side analysts downgrade their expectations as time goes on. However, we are currently in an unusual situation where earnings revision ratios are positive across all geographies (Figure 6), indicating that the sell-side has not been bullish enough and are having to scramble to upgrade forecasts.
For example, the average earnings beat for fourth-quarter earnings was 18% for the 264 S&P 500 companies that had reported earnings as of the time of writing. However, the average S&P 500 stock actually fell 1% since reporting, indicating a mismatch between sell-side and market expectations. For comparison purposes, pre-Covid, a 5% beat would be considered significant.
Figure 6. Earnings Revisions Ratios
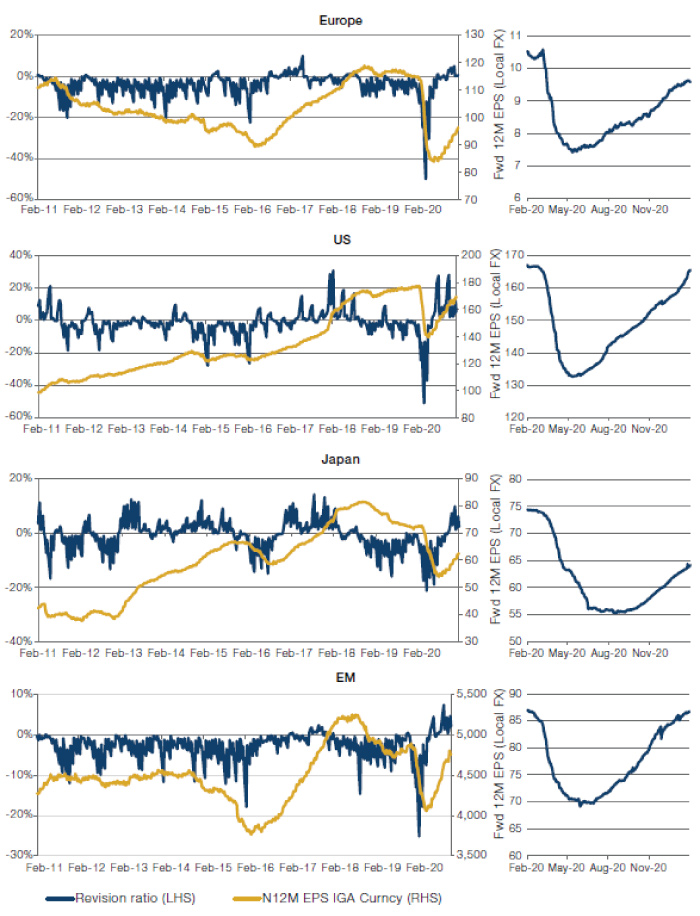
Source: IBES, Morgan Stanley, Bloomberg, MSCI, Man Solutions; as of 5 February 2021. Revision ratio is calculated as (number of upgrades – number of downgrades) / total estimates.
With contributions from: Paul Chambers (Head of Quantitative Investment and Research, Man GLG), Christian Laner (Quantitative Researcher, Man GLG) and Henry Neville (Analyst, Man Solutions).
You are now leaving Man Group’s website
You are leaving Man Group’s website and entering a third-party website that is not controlled, maintained, or monitored by Man Group. Man Group is not responsible for the content or availability of the third-party website. By leaving Man Group’s website, you will be subject to the third-party website’s terms, policies and/or notices, including those related to privacy and security, as applicable.