Bitcoin: The Promethean Bubble
In Greek mythology, for the crime of giving the gift of fire to mankind, Prometheus was condemned by the gods. Chained to a rock, every day his liver was pecked out by a giant eagle, and every night it grew back.
Bitcoin isn’t exactly like Prometheus’s liver, but it does have one similarity. Every time a bitcoin bubble bursts, another grows back to replace it. By our estimation there have been five bitcoin bubbles, including the current one:
- 8 April 2011 - 8 June 2011 - 18 November 2011: Bitcoin goes from USD0.75 to USD29 before falling back to USD2, a rise of 3,847% followed by a fall of 93%;
- 3 January 2013 - 9 April 2013 - 16 April 2013: Goes from USD13 to USD234 then back to USD76; a rise of 1,648% followed by a fall of 68%;
- 2 October 2013 - 29 November 2013 - 5 October 2014: Goes from USD113 to USD1,137 then back to USD309; a rise of 908% followed by a fall of 73%;
- 16 July 2017 - 17 December 2017 - 5 February 2018: Goes from USD1,857 to USD19,042 then back to USD7,101, a rise of 921% followed by a fall of 63%;
- 16 March 2020 – 9 January 2021 – 11 January 2021: Goes from USD4,905 to USD40,858, then back to USD35,715, a rise of around 833% followed by a fall of 12% (Figure 1).
Now clearly a further implosion is well within the bounds of probability. It should almost be a base case given how often it has happened before. We note, however, that this very frequency makes the bitcoin narrative somewhat atypical relative to the great bubbles of the past. Figure 2 shows a selection of history’s largest financial bubbles. These tend to be either a one-off phenomenon (striped tulips can now be bought for GBP2 in Morrisons, and don’t look like spiking again any time soon), or one has to wait many years for another bubble (oil or gold). Bitcoin has had four completed ‘bubbles’ in under 10 years. Which leads us to consider another conclusion: instead of considering each individual spike and fall as a discrete bubble, there may be more merit in the argument that this volatility is simply part of the price discovery in a new asset class, and that these are not bubbles, but part of a not-so-random walk that will eventually dwindle to give bitcoin more stability, and ultimately, legitimacy.
Figure 1. Bitcoin Soars
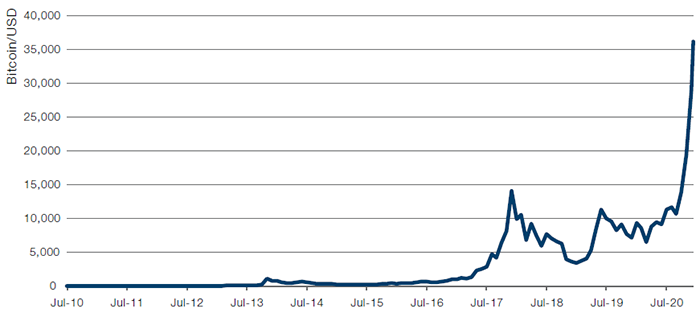
Source: Bloomberg; as of 11 January 2021. This chart uses monthly closing prices. Accurate as of 10am GMT, 11 January, price may have subsequently changed.
Figure 2. Selected Financial Bubbles Throughout History
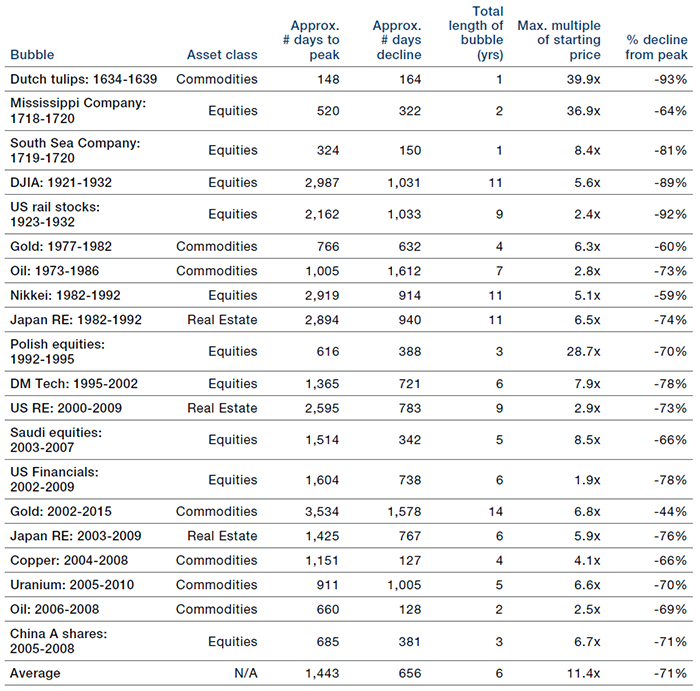
Source: Man Solutions; as of 2017.
Inflation and the US Election
The Georgia runoff elections has given the Democratic party 50 seats in the US Senate. With the tie-breaking vote cast by the Vice-President, the party now controls of both houses of Congress and the Presidency, the first time since the 2008 election. With all the levers to enact legislation now in the hands of one party, we believe the likelihood of seeing further fiscal stimulus applied to the US economy is now elevated.
This puts renewed focus on leading inflationary indicators, of which two are notably showing an uptick: the ISM Manufacturers’ Prices Paid Index and the ISM Supplier Deliveries Index (Figures 3-4). This double uptick implies that US manufacturers are not only having to pay more for their raw materials, but that they are also having to wait longer for their deliveries.
An underappreciated element of the coronacrisis is that it was not just a demand slump: as anyone who tried to buy toilet roll in the UK (and Australia) in March will appreciate, global supply chains experienced disruption as well. If the Democrats do enact a concerted stimulus plan which involves infrastructure spending, it is conceivable that supply chains will struggle to keep pace with the additional demand for raw materials, forcing inflation up even though total demand may not necessarily be higher than before the pandemic.
Figure 3. ISM Manufacturers’ Prices Paid Index
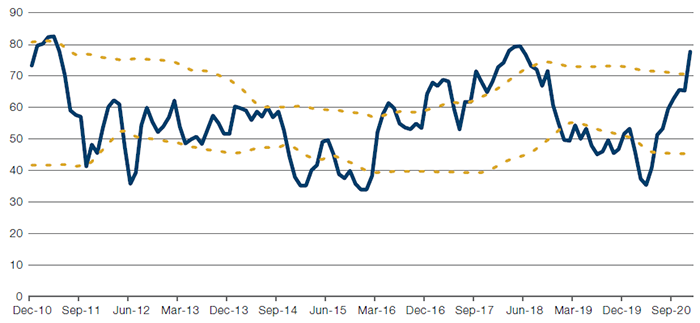
Source: ISM, Bloomberg; as of 8 January 2020. Yellow lines are moving averages +/- 1 standard deviation on a 3-year lookback.
Figure 4. ISM Supplier Deliveries Index
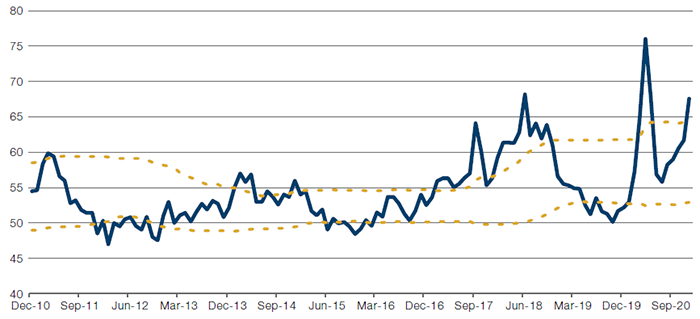
Source: ISM, Bloomberg; as of 8 January 2020. Yellow lines are moving averages +/- 1 standard deviation on a 3-year lookback.
With contribution from: Henry Neville (Man Solutions, Analyst).
You are now leaving Man Group’s website
You are leaving Man Group’s website and entering a third-party website that is not controlled, maintained, or monitored by Man Group. Man Group is not responsible for the content or availability of the third-party website. By leaving Man Group’s website, you will be subject to the third-party website’s terms, policies and/or notices, including those related to privacy and security, as applicable.