ARTICLE | 5 MIN | VIEWS FROM THE FLOOR

How Much Can the US Government Borrow?

February 2, 2021

As the size of the US government debt increase, will this lead to inflation or interest rate rises?

How Much Can the US Government Borrow?

Like a lot of governments during the coronavirus pandemic, the size of the US government debt has increased, and rapidly. Indeed, the US has almost USD8 trillion of debt to refinance in 2021 (Figure 1).

In a world of rock-bottom interest rates, this isn’t necessarily a problem, as the US is able to refinance its debt relatively cheaply. Indeed, at her confirmation hearing for the office of Secretary of State for the Treasury, Janet Yellen made a clear case for using the environment of low rates to spend more. However, at some point, continued expansion of debt will test the limits of public sector borrowing, limits that we will not be able to identify until we hit them.

There are two main buyers for US Treasuries – overseas creditors and the Federal Reserve. In theory, at some point foreign official creditors will demand a higher interest rate to absorb expanding bond issuance. Left unchecked, higher rates would be uncomfortable for economic expansion. Another option is for the Fed to continue to buy the debt, expanding its balance sheet, and raising the threat, for some, of a rise in inflation. How big this risk is the great unknown – we have had more than a decade where stubborn inflation refused to budge at all.

As Figure 2 shows, there has been an identifiable uptick in the amount of US debt owned by the Fed, whereas foreign ownership has stayed relatively flat. So far, this suggests that the inflationists have more to worry about than those who worry that a rising stock of debt will push interest rates higher. Ultimately, the constraints on public sector borrowing will be a lively debate we expect to hear much more of over coming years, particularly if the Biden administration shifts towards more sustained fiscal spending.

The best thing we have read on it to date comes from a St Louis Fed blog earlier this month: “There is presumably a limit….[but] we can only know once we get there.”

Problems loading this infographic? - Please click here

Source: Bloomberg; as of 27 January 2021.

Problems loading this infographic? - Please click here

Source: Bloomberg; as of 1 February 2021.

They’re Trolling Us

We’ve previously written of how prospects for stocks valued at EV/sales >20x don’t look good: using the Russell 1000 and MSCI World, stocks above 20x EV/sales average a cumulative relative underperformance of 42% and 22%, respectively, with a median cumulative underperformance of 73% and 50% (Figure 3).

In what feels like a direct rebuke to our considered analysis in the fourth quarter of 2020, data from the middle of January show that these stocks now account for around a quarter of trading volumes in the US (Figure 4), a figure which is in the 96th percentile since 1985. This surge has come alongside other concentrations of unusual factor attributes in the share of trading volume: the volume participation of stocks with share prices below USD1 is in its 99th percentile, and those with negative trailing EBITDA are in the 100th percentile.

Strange times indeed.

Problems loading this infographic? - Please click here

Source: Man Numeric; as of 31 August 2020.

Problems loading this infographic? - Please click here

Source: Compustat, Goldman Sachs; as of 21 January 2021.

The Roaring Twenties? UK Savings and the Wealth Effect

We have some sympathy for those who think that we will emerge from the coronavirus pandemic into the ‘Roaring Twenties’, a decade characterised by high demand as consumers spent their savings. After all, the savings rate in the UK has steepled in the wake of the pandemic (Figure 5).

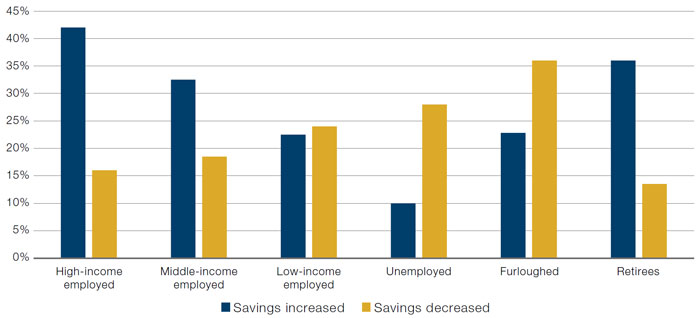
However, we would urge a note of caution to this idea. The majority of excess savings in 2020 was distributed to higher income households and retirees, which have a lower marginal propensity to consume than those on lower incomes (Figure 6). This challenges the notion that there is a tidal wave of pent-up savings ready to hit the economy: 2021 may see a meow instead of a roar.

Nevertheless, there are reasons for optimism. In contrast to the Great Financial Crisis, the wealth effect observed in 2020 was positive, with a rise in asset prices such as equities and housing (Figure 7). In addition, consumer credit balances have been significantly paid down during 2020. If these are rebuilt as lockdowns are lifted, and the excess savings are actually deployed, then we could see buoyant consumer spending to boost the UK recovery.

Problems loading this infographic? - Please click here

Source: Bloomberg; as of 25 January 2020.

Figure 6. Higher Income Households and Retirees More Likely to Have Increased Savings During Covid-19

Higher Income Households and Retirees More Likely to Have Increased Savings During Covid-19

Source: Bank Of England; as of 25 November 2020.
Note: High-income employed households are households where the main earner is either employed or self-employed and the household income is in the top quintile; middle-income employed households are households where the main earner is either employed or self-employed and the household income is in the third or fourth quintile, and low-income employed households are households where the main earner is either employed or self-employed and the household income is in one of the bottom two quintiles. Retirees are households where the main earner is retired.

Figure 7. UK Wealth Effect 2020 Versus 2008

Index December 2008 December 2020
UK Nationwide House Price YoY -15.9% 7.3%
FHFA US House Price Index YoY -10.1% 7.8%
MSCI World Local YoY -40.1% 11.7%

Source: Bloomberg; as of 31 December 2020.

With contribution from: Ed Cole (Man GLG, Managing Director – Equities) and Dan Taylor (Man Numeric, CIO).

For further clarification on the terms which appear here, please visit our Glossary page.

This information is communicated and/or distributed by the relevant Man entity identified below (collectively the "Company") subject to the following conditions and restriction in their respective jurisdictions.

Opinions expressed are those of the author and may not be shared by all personnel of Man Group plc (‘Man’). These opinions are subject to change without notice, are for information purposes only and do not constitute an offer or invitation to make an investment in any financial instrument or in any product to which the Company and/or its affiliates provides investment advisory or any other financial services. Any organisations, financial instrument or products described in this material are mentioned for reference purposes only which should not be considered a recommendation for their purchase or sale. Neither the Company nor the authors shall be liable to any person for any action taken on the basis of the information provided. Some statements contained in this material concerning goals, strategies, outlook or other non-historical matters may be forward-looking statements and are based on current indicators and expectations. These forward-looking statements speak only as of the date on which they are made, and the Company undertakes no obligation to update or revise any forward-looking statements. These forward-looking statements are subject to risks and uncertainties that may cause actual results to differ materially from those contained in the statements. The Company and/or its affiliates may or may not have a position in any financial instrument mentioned and may or may not be actively trading in any such securities. Unless stated otherwise all information is provided by the Company. Past performance is not indicative of future results.

Unless stated otherwise this information is communicated by the relevant entity listed below.

Australia: To the extent this material is distributed in Australia it is communicated by Man Investments Australia Limited ABN 47 002 747 480 AFSL 240581, which is regulated by the Australian Securities & Investments Commission ('ASIC'). This information has been prepared without taking into account anyone’s objectives, financial situation or needs.

Austria/Germany/Liechtenstein: To the extent this material is distributed in Austria, Germany and/or Liechtenstein it is communicated by Man (Europe) AG, which is authorised and regulated by the Liechtenstein Financial Market Authority (FMA). Man (Europe) AG is registered in the Principality of Liechtenstein no. FL-0002.420.371-2. Man (Europe) AG is an associated participant in the investor compensation scheme, which is operated by the Deposit Guarantee and Investor Compensation Foundation PCC (FL-0002.039.614-1) and corresponds with EU law. Further information is available on the Foundation's website under www.eas-liechtenstein.li.

European Economic Area: Unless indicated otherwise this material is communicated in the European Economic Area by Man Asset Management (Ireland) Limited (‘MAMIL’) which is registered in Ireland under company number 250493 and has its registered office at 70 Sir John Rogerson's Quay, Grand Canal Dock, Dublin 2, Ireland. MAMIL is authorised and regulated by the Central Bank of Ireland under number C22513.

Hong Kong SAR: To the extent this material is distributed in Hong Kong SAR, this material is communicated by Man Investments (Hong Kong) Limited and has not been reviewed by the Securities and Futures Commission in Hong Kong.

Japan: To the extent this material is distributed in Japan it is communicated by Man Group Japan Limited, Financial Instruments Business Operator, Director of Kanto Local Finance Bureau (Financial instruments firms) No. 624 for the purpose of providing information on investment strategies, investment services, etc. provided by Man Group, and is not a disclosure document based on laws and regulations. This material can only be communicated only to professional investors (i.e. specific investors or institutional investors as defined under Financial Instruments Exchange Law) who may have sufficient knowledge and experience of related risks.

Switzerland: To the extent this material is made available in Switzerland the communicating entity is:

  • For Clients (as such term is defined in the Swiss Financial Services Act): Man Investments (CH) AG, Huobstrasse 3, 8808 Pfäffikon SZ, Switzerland. Man Investment (CH) AG is regulated by the Swiss Financial Market Supervisory Authority (‘FINMA’); and
  • For Financial Service Providers (as defined in Art. 3 d. of FINSA, which are not Clients): Man Investments AG, Huobstrasse 3, 8808 Pfäffikon SZ, Switzerland, which is regulated by FINMA.

United Kingdom: Unless indicated otherwise this material is communicated in the United Kingdom by Man Solutions Limited ('MSL') which is a private limited company registered in England and Wales under number 3385362. MSL is authorised and regulated by the UK Financial Conduct Authority (the 'FCA') under number 185637 and has its registered office at Riverbank House, 2 Swan Lane, London, EC4R 3AD, United Kingdom.

United States: To the extent this material is distributed in the United States, it is communicated and distributed by Man Investments, Inc. (‘Man Investments’). Man Investments is registered as a broker-dealer with the SEC and is a member of the Financial Industry Regulatory Authority (‘FINRA’). Man Investments is also a member of the Securities Investor Protection Corporation (‘SIPC’). Man Investments is a wholly owned subsidiary of Man Group plc. The registration and memberships described above in no way imply a certain level of skill or expertise or that the SEC, FINRA or the SIPC have endorsed Man Investments. Man Investments Inc, 1345 Avenue of the Americas, 21st Floor, New York, NY 10105.

This material is proprietary information and may not be reproduced or otherwise disseminated in whole or in part without prior written consent. Any data services and information available from public sources used in the creation of this material are believed to be reliable. However accuracy is not warranted or guaranteed. © Man 2025